|
|
The Second Half
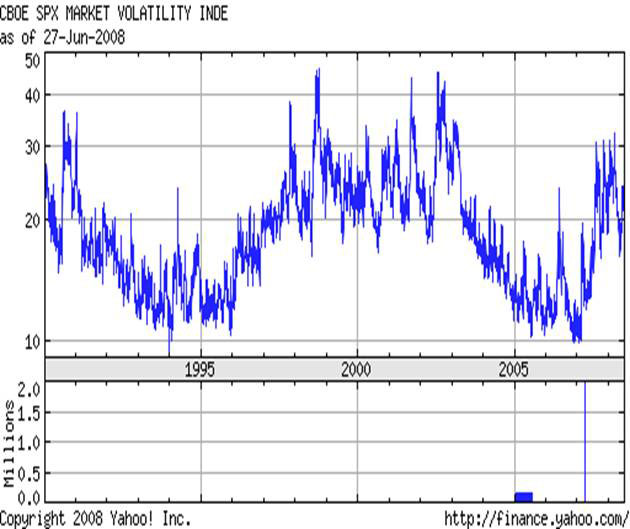
I am making the move for two reasons. The city has become so cluttered, so disorderly, and so dirty that I spend too much of my day just dealing with getting from point “A” to point “B” and that leaves me with too little time to focus on the markets. Besides I am not a very tolerant person and when I have to spend two hours or more in a car for a thirty minute appointment just four miles from my house, I tend to get more than a little bent out of shape. Then there is the security issue. Lima is a city of twelve million people, with an infrastructure for three million, and probably half the population is at or just below the subsistence level. By at the subsistence level, I mean they barely make enough to sustain life. If they are below it, they don’t. If the events I am projecting come to pass, and I am convinced they will, these folks who just survive will come over the wall surrounding my house someday and there won’t be much I can do about it. There are forces at work in Latin America that want to level the playing field and they are willing to use any means available. These forces are from the Left and the movement is quite similar to what occurred in 1930. These movements led to agrarian reforms that, in all cases that I’m aware of, set Latin countries back decades. For example, just after WW II Argentina was the second largest grain producer in the world. After the so-called agrarian reform they fell off of the list altogether. Now many third world countries like Brazil and Peru are experiencing an economic boom due to the surge in demand for commodities. Grains, coffee, cotton, base metals and precious metals are being shipped as fast as they can be taken from the earth. That’s the good news. The bad news is that there isn’t much of a trickle-down effect. Most of the wealth is being accumulated by a few individuals and that is not going unobserved by the masses. Peru mines 15% of the world’s gold and silver and everyone sees that they have tripled in price so they conclude that the owners of the mines must be swimming in riches. That’s what the left focuses on, ignoring the fact that costs for the miners have soared even more than the price of gold. Human beings are very selective on what they focus on, and the hungrier they are, the more selective they become. Politicians play to that selective vision and, given the right mix, civil disobedience is just around the corner. Therefore I seek as much isolation as I can find. Right about now you might think that the scenario outlined above will be restricted to third world countries, but I beg to differ. The United States is headed down the very same path. You have a population that lives day to day on a need-to-know basis, and sadly they desire to know nothing, secure in the belief that the folks who run the show will make sure that no bumps are found on the road. In fact, the mantra has been to avoid any and all bumps at all cost. Regrettably, life just doesn’t work like that and those folks who so easily gave up bits and pieces of their freedom for the illusion of security and the promise of continued economic prosperity are about to come face-to-face with reality. What is truly amazing though is the complacency shown by the average investor when faced with the troubled markets. On February 1st the Volatility Index ($VIX) closed at 24.02 while the September Dow futures contract closed out that same day at 12,780. Yesterday, the September Dow closed at 11,357 and while the VIX closed at 23.44 meaning that the stock market has fallen more than 10% and yet no one besides me is worried about it. Absolutely amazing!
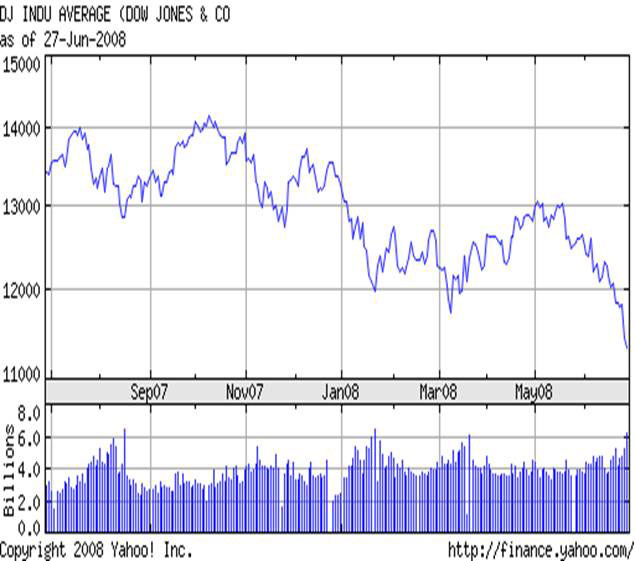
Source: www.finance.yahoo.com In June alone the Dow Jones Industrial Average was down 9.4% and that is the worst June performance since 1930, the year the Great Depression really took a grip on the US, and yet no one is worried. I am more than amazed, I am bewildered and perplexed. There are warning signs everywhere for anyone to see and yet we stumble through life like a nation of blind men and women. Secure in the “knowledge” disseminated widely on CNN that it will somehow all work out; we go through our daily lives convinced that the bottom is at hand. The markets have taught me though that unfounded convictions pave the road to bankruptcy, and are second only to “hope” when it comes to the destruction of capital. When it comes to the markets, I never hope and try not to develop emotional attachments to my positions. Most analysts come at you like Moses coming down from the mountain with a set of stone tablets, but nothing is that certain in the financial world. Investors are about to learn that the hard way. For the most part recent developments in the Dow Jones Industrial Average has silenced the financial news cheerleaders for the moment, but rest assured they’ll be out in full force on Monday. It was a difficult week made worse by a wishy-washy Fed statement that declared “economic activity continues to expand” while inflation should “moderate later this year and next year”. The stock market is always quick to recognize manure when it sees it and this was no exception. The Fed statement came out on Wednesday at 2:10 pm EST and was followed by a one hour rally that took the September Dow as high as 11,915. Then selling set in and continued right on through Friday’s closing bell. On Friday the September Dow futures contract closed down 105 points at 11,357 and that is a new bear market closing low. A look at the one-year daily chart above clearly shows a pattern of lower highs and lower lows dating back to the October all-time closing high. [Really it dates back to the July high as October was a false break high.]
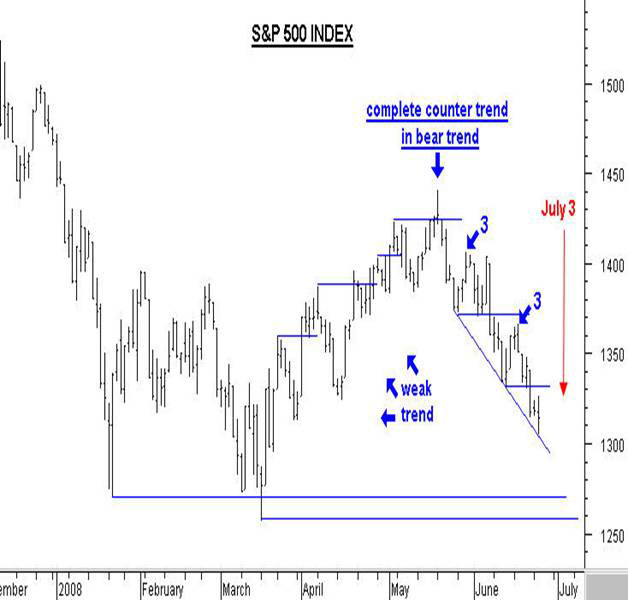
Now we are beginning the “big debate” about whether or not we are in a bear market. Such stupidity! A bear market is generally defined as a minimum correction of 20% and to date the Dow has corrected 2,807.53 points and that equates to 19.93%, close enough for government work. What is interesting and unusual is that the Dow is leading almost all the other major indexes down, and that goes for the S & P 500 as well. Arguing for or against a bear market is like questioning if there is an iceberg as the Titanic sinks. What you really need to know is just how far is down and, if possible, within what time frame. Both very good questions and both difficult to answer, at least as far as I am concerned. When the S & P was way up there above 1,400.00, I told you the Dow would fall down to 10.725 and the S & P would bottom around 1,234.00. On Friday these two indexes closed at 11,346 and 1,278.00 respectively so we are not that far away. Time wise I was looking at the 3rd of July for a bottom and again we are not that far away. It should be mentioned that Friday’s close in the S & P was just two points above good support at 1276.00. After the market’s downside reaction following 9/11, there was a countertrend move that made three tries to break through what was then strong resistance at 1,276.00. From there the market collapsed all the way down to 775.00 seven months later. Thursday qualified as a 90% down day. This is defined as points lost equals at least 90% of the sum of points gained plus points lost, and downside volume equals at least 90% of upside volume plus downside volume. This is the second such 90% down day since the May high. Most intense declines experience three or four such downside days so we can expect at least one more before we see a decent bottom. I must admit that I was surprised that we didn’t see some sort of rally on Friday, as is usually the case, so it makes it hard to guess what might be next. Personally I would not be surprised to see some sort of weak reaction to the upside on Monday and Tuesday, with maybe a slightly higher high on Wednesday, and then a resumption of the move down to lower lows after the 4th of July holiday. The wild card is that it will be a short week and a lot of traders just might take the whole week off, especially since the trend is down, so volume will be thin. I should also mention that volume was extremely heavy on Thursday and Friday with well over five billion shares traded each day and that explains why Lowry’s selling pressure reached a new high while Lowry’s buying pressure continues to fall. I still hold to the 10,725.40 price target for the Dow and would expect to see it hit within twelve trading sessions. From there I would expect an eight to ten day rally, followed by a retest of the low, and then a thirty to forty-five day reaction that could take the September Dow as high as 12,444 but would more than likely stop at 12,065. I have been short the Dow from 12,850 and will begin to take profits at 10,950, but if I were to see two consecutive closes below 10,725.40 I would immediate reestablish my short position and might even double up. I do not believe that would happen. Instead we’ll likely get our last good rally, sucking in investors one more time, and then I think the Dow will turn down in late September and crash sometime in late November. This crash will take the Dow down below the support at the 10,725.40 area (the 50% retracement back down to the 2002 low) and will fall to a minimum of There are some very important long term Fibonacci support/resistance numbers in the Dow, S & P, and Transportation Indexes that you can use as a guide. They are as follows:
I have highlighted the 50% retracements as they are the most important numbers and all are calculated from their respective all-time highs down to the 2002 lows. Then you have even more critical numbers calculated from the bull market beginning to the bull market top last year:
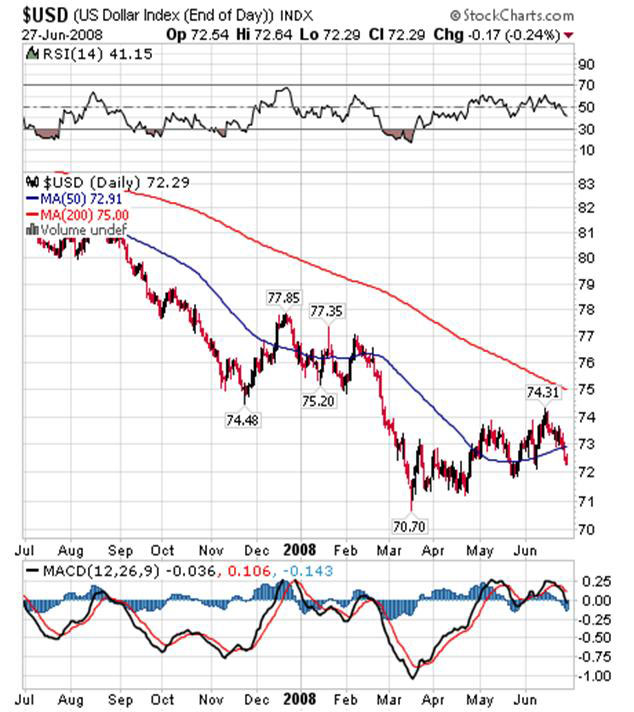
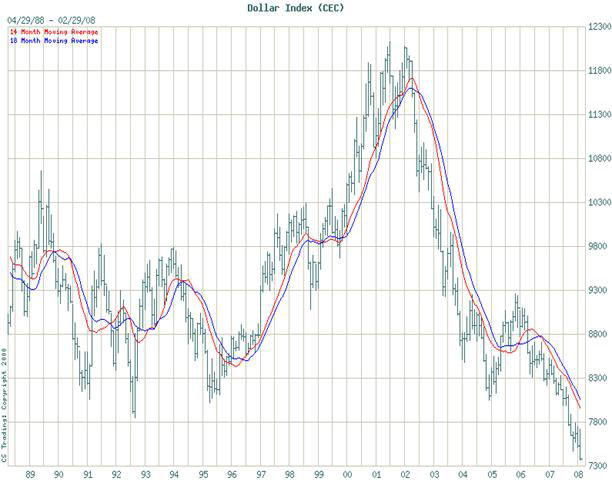
As bad as stocks look, the dollar looks even worse to me and the recent Fed action did absolutely nothing to improve the situation. Now I would not be the least bit surprised to see the European Union central banks raise rates this week and just might be the shove it needs to fall off the cliff. Numerous analysts and gurus have been calling for a rally in the greenback for two months, and they have been wrong for two months. For the US Dollar Index to really gain any traction it’s important for it to move and close above the 74.48 mark which is where it broke down from. All the US Dollar Index really did was come back up to it in a pattern that looked more like distribution than anything else. I think that distribution has just about run its course and the dollar may be ready to head down to new lows. I really don’t think the Europeans will sacrifice their economies just to save the dollar and a lower dollar will most likely bring a negative reaction from OPEC nations. Note in the one-year daily chart above, that RSI, MACD, and the histogram have all turned down and Friday’s decline broke the bottom band of a trend line that was acting as support.
The reason for the decline in the dollar is quite simple: the Administration and the Federal Reserve have been grossly mismanaging the US economy. This mismanagement has gone on for decades with very few interruptions. Paul Volker was an interruption who managed to exercise his will even with an administration that created debt in large quantities. He was able to do so because the US was just making the shift from creditor nation to debtor nation, and the dollar was the reserve currency for the world. That luxury no longer exists as the United States in by far the largest debtor nation the world has ever seen. Until recently most of that debt was financed by foreigners but that is no longer the case as the greenback loses its reserve status. The Fed is now increasingly forced to cover the growing gap with the printing press and, as a result, the money supply now increases at a large 16% per year. Other countries assisted by printing more currency, and the result is that we now have a world-wide inflation. The Fed’s only hope is to control the situation and slowly inflate away the massive debt, along with American purchasing power, but it is a very dangerous game. The dollar is now a great gauge for inflation. As long as it devaluates, you know that inflation is present but on the other hand you are devaluating the reserves of foreigners who are stuck with massive amounts of US dollars and bonds. The Arabs and Chinese are great examples and there has to be a point, some level in the US Dollar Index, where they decide they’ve had enough and dump dollars regardless of the consequences. It is my belief that we are now very close to that level. My line in the sand has been 70.44 and it was tested back in March. Since then the greenback has created the appearance of a rally but I think that is an illusion; the dollar has really been undergoing a stealth distribution, sort of a last chance saloon. The range of that distribution has been and remains 70.44 to 75.47. Break out above it and it will be deflation, break out below it and it will be increased inflation and maybe even hyperinflation.
Those who wish for a dollar rally had better be careful what they wish for. A dollar rally can only happen with deflation, and deflation in a country swamped with debt would be absolutely devastating. I believe the Fed is reduced to doing nothing here. They set the wheels of inflation in motion and now will stand back at let the rest of the world deal with it. They certainly cannot, will not, raise rates or contract the money supply. They must continue to print under any circumstance. If the rest of the world raises rates then it will drive the dollar down and the Fed can blame them. In short, they are reduced to finger pointing (as are the Europeans). We’ve already seen signs of it as two major European banks (Royal Bank of Scotland and Barclays) are now blaming the Fed for current credit and inflation problems. I have been in the inflationary camp for two years but never comfortable with it. From 1999 to late 2005 I believed we’d see deflation, and now that everyone is calling for inflation, I am drifting back toward that camp. I am convinced that the next move in the US dollar will finally decide the issue once and for all so keep your eyes open. So what do you do given the fact that the US has almost no say about its economic destiny and we appear to be headed for a significant inflationary bout, always keeping in mind though that deflation is possible? You do what the smart money does; you buy gold. The yellow metal, and silver to a lesser degree, is the one thing that has stood the test of time. From time to time the human race has traded shells, beads, gems, tulips, and the like but it has traded gold/silver for more than five thousand years, and always as a store of value. I believe that gold is in fact the only true store of value and that’s why people turn to it during times of inflation (1974 to 1981), deflation (1930 to 1932), war, famine and natural disasters. People have been killed for it and wars have been fought over it. To the best of my knowledge, no one fought a war over a tulip. Lately there has been a lot of talk about the bull market in gold and a number of analysts have espoused the opinion that gold’s rally was extremely overdone and is now headed for a significant decline. The 731.00 level seems to be the target of consensus. I of course disagree vehemently. I just don’t get up in the morning and look for windmills to tilt at, although it may seem that way. I do though spend an awful lot of time looking at charts, reading about the history of gold, and calculating support/resistance levels. I also spend considerable time trying to determine which support/resistance levels are important and which are less than significant. Everybody comes up with more or less the same numbers but very few can decipher the significance, or lack of it, for each number.
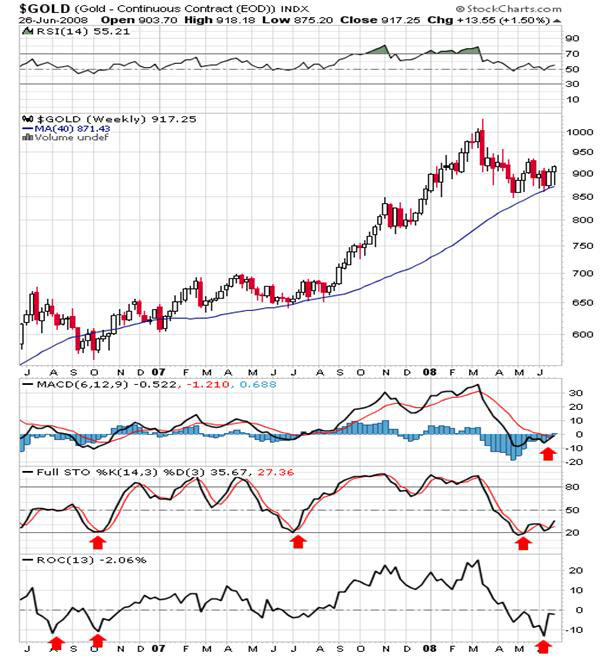
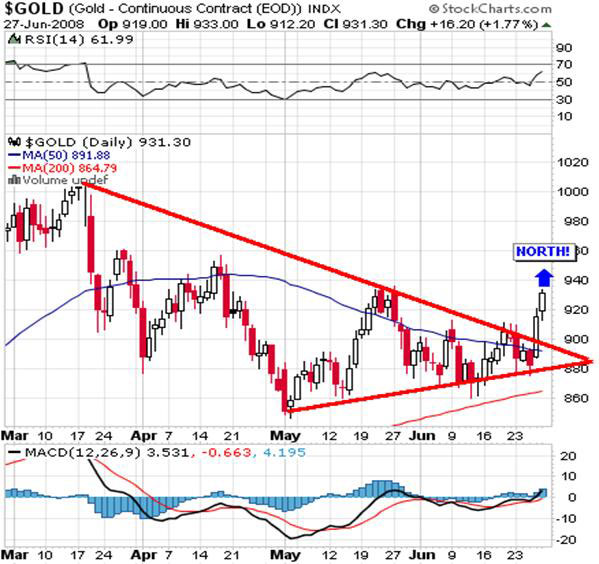
The preceding weekly chart for gold does not include Friday’s 16.20 gain in gold, but is quite illustrative in any event. You can see that the price of gold has held nicely above the 50-wma and the RSI, MACD, and histogram have all turned up. Also, note the two series of three red arrows below and you’ll see that gold has bottomed precisely where it did in previous occasions. What is even more telling is the fact that this particular correction was quite shallow (15.4%) versus the expectations for a 25% correction shared by most analysts. As a result, many folks are now sitting on the sidelines with their hands in their empty pockets wondering what to do now. A look at the daily chart below shows that gold has broken out to the upside. Draw a line from the $1,033.90 top, have it connect to the $935.40 peak, and then continue on to the right and you’ll see that gold is now trading well above it:
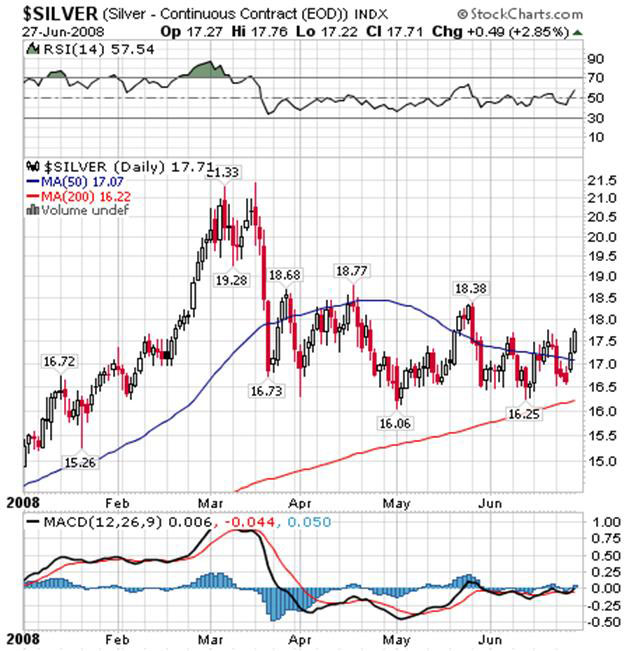
If and when these people decide to get back in the market, and they will, it could easily propel gold back up to test strong resistance at 999.40. I want to make it clear that gold’s has bottomed, did break out of a compressed trading range just like in August 2007, and it is headed higher. As you can easily see on gold’s weekly chart, it is a long, long way from being overbought. Finally, we see that silver is in a similar pattern but is lagging gold. The real work to the upside will begin when silver takes the lead from the yellow metal and that could still be weeks away. From a technical perspective, silver looks better with the RSI, MACD, and histogram are headed up. When I look at silver’s daily chart, I see a long period of accumulation following an initial decline.
This accumulation is really a base for the next move to the upside. What’s more I would like to remind everyone that both gold and silver built a huge sixteen month base that only resulted in seven month rally. I believe that gold and silver never really expressed themselves fully to the upside and that is why the recent correction was so shallow. Under normal circumstances, I would have expected a nine to eleven month rally and maybe even more. So now we have a sixteen month base, followed by a short-lived rally and yet another three/four month base and we have the raw material for a rally that can easily take gold well beyond strong resistance at $1,148.70 and on up to $1,447.50 at the very least. Finally, I have listed the Fibonacci support/resistance levels for both gold and silver below so you can follow the price movements with a scorecard.
In conclusion, we are headed toward elections in the US and I suspect that the Republicans will again win the White House and the Democrats will control both houses. That means that the war in Iraq will drag on until God knows when, Israel will more than likely attack Iran and that will give McCain the justification to go in to Iran as well. The US doesn’t produce a surplus and our foreign friends are less likely to pay for the pleasure, so that ensures that we’ll print even more dollars. Many feel that Bernanke wants to raise interest rates but will wait until the November elections before he does so. Inflation is truly a problem, and he should raise rates, but I maintain that he can’t because the country is too far in debt. I would like to see him do it as it would be the “right” thing to do but I know of no politician who’s done the right thing. Do you? The dilemma for Bernanke is that eventually all inflations end in deflation; any German knows that. Higher rates would lead to a stronger dollar, over the short run, and that would hasten the deflationary scenario. Deflation is coming; it’s just a question of when. Buy gold and avoid paper assets of all kinds and classes. If you need a currency, stick to the Swiss Franc. The real business of Switzerland is money and they will never do anything to jeopardize that business. ebo@dtanalysis.com Ignacio Merino 636 Phone: 001-51-56-973-5599
|
 |
 |

 It seems hard to believe but June comes to an end at midnight on Monday and, even harder to believe, so does the first half of 2008. When you’re twenty years old you think you have forever and time passes ever so slowly, but when you’re fifty-something years old, time just zooms by and it’s an uncomfortable feeling. At least it is for me. I can’t remember the last time I went to bed with the feeling that I finished everything. I’m the type of person who likes to have everything in its place and nothing left undone. Unfortunately, as one grows older you have children, grandchildren, and an accumulation of “things”, many admittedly useless, and your life becomes cluttered. I’m probably more aware of the clutter than most because I’m in the process of moving from Lima back to the beach in southern Peru. I spent two years living on a beach near Pisco, an area devastated by the earthquake last August, and I’ve decided to move back. You’re never really aware of the clutter until you have to pack it, and then unpack it, all up. I always run across things that evoke the “whatever possessed me to buy that” reaction, and then I ship it off to Goodwill. Aside from the Goodwill stuff, I always feel like some archeologist unearthing bits and pieces of some former civilization. A photo here, an object there, and they bring back an avalanche of old memories. Most good, but some sad.