|
Election Year Coverage: The Stock Market Impact Uncover the economic rationale behind the presidential cycle and learn its implications for the stock market during the election year. With a two-term Republican president leaving the White House, the presidential race is wide open. Economic issues cast a shadow over the campaign. Whether the economy is technically in a recession will not be known for several months, but growth has clearly slowed. The stock market has anticipated the slowdown, with the Dow Jones Industrial Average falling more than 10 percent from its recent record high, and the Federal Reserve has lowered borrowing costs in an effort to jump-start the economy. Which year is being described? Certainly, 2008 fits. But so does 1960: Eisenhower was on his way out of the White House, the National Bureau of Economic Research later declared that a recession had started on April 30, the DJIA eventually declined 17 percent from its January peak to its October low, and the Federal Reserve lowered interest rates twice that year. Take away the two-term Republican president, and it could very well describe the first half of 1980. Various parts could be substituted for almost any election year. Why? The economy and stock market tend to follow a pattern known as the four-year presidential cycle. The Presidential Cycle The federal government accounts for 20 percent of the economy, so changes in fiscal policy undoubtedly impact gross domestic product. Since the president, the entire House of Representatives and one-third of the Senate are up for election every four years, the executive and legislative branches have incentive to stimulate the economy via extra spending or tax cuts heading into the election year. More specifically, they are more likely to respond rapidly to signs of economic weakness. This year's bipartisan tax rebate plan in response to the housing slump is a case in point.
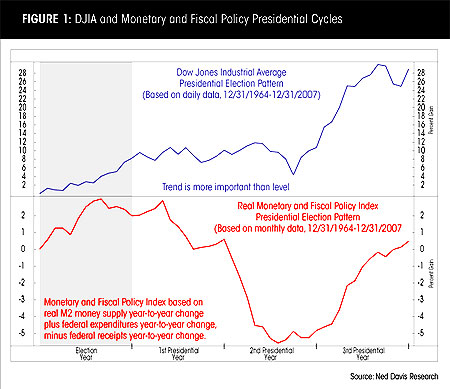
Figure 1 shows the monetary and fiscal policy presidential cycle, which is the year-to-year change in M2 money supply (monetary policy) plus the year-to-year change in federal expenditures, minus the year-to-year change in federal receipts (fiscal policy). When the line in the bottom section of the chart is rising, government stimulus is increasing. Government stimulus has tended to bottom shortly before midterm elections, accelerate during the pre-election year, peak around election time, and fall sharply during the first and second years of the presidency. The top section shows that the DJIA has tended to anticipate the stimulating effects, peaking and bottoming in advance of the Monetary and Fiscal Policy Index. The average gains for each year of the election cycle underscore the effects of the stimulus. The pre-election year, when the stimulus has started to take effect and the market has anticipated more, has been the strongest, with the DJIA climbing a median of 15 percent. The election year has been the second best, with a median gain of 8 percent. The first and second years have been by far the weakest, at -1 percent and 2 percent, respectively. Each cycle is unique, but the underlying themes usually hold. For example, the DJIA gained only 6 percent in 2007, well below the pre-election year average. But the positive number kept the winning streak alive - the Dow has not declined during a pre-election year since 1939. Election-Year Trends
The 1960 election is a case in point. Richard Nixon and John F. Kennedy were locked in a close race, and the DJIA did not bottom until Oct. 25, just one week before the election. That date would be prominent 44 years later. With the outcome of the contest between John Kerry and George W. Bush in doubt through the fall, the market bottomed on Oct. 25, 2004. The protracted controversy of the 2000 election also illustrated how political uncertainty can weigh on the market. The race was tight through the fall, and the DJIA fell to a seven-month low on Oct. 18. The rally lasted until Nov. 6, the day before the election. The uncertainty of the Florida recount prevented the typical postelection relief rally. The DJIA slumped 6 percent to the Dec. 20 low, one week after the Supreme Court's ruling and Al Gore's concession speech. Historically when the outcome was obvious months in advance, the market has been able to focus on other factors. For example, Bill Clinton was widely expected to win re-election in 1996. With the economy, earnings and interest rates in good shape, the DJIA soared 26 percent, its biggest election-year gain in 68 years. Election-year tendencies are also prominent within stock styles. Large-caps have tended to outperform small-caps early in an election year. About the time the market has bottomed, high-beta small-caps have tended to outperform. Growth stocks usually have done better than value stocks until late in the first quarter, at which time value has begun a steady period of relative strength, lasting through the third quarter of the postelection year.
Party's Chances Figure 2 also shows the DJIA's performance during the election year when the incumbent party has won (black dashed line) or lost (blue dashed line). The DJIA has been weak during the first part of the year under both scenarios, as the primary season highlights the uncertainty of the coming election. In both cases, a rally has tended to occur from late May into early September, but then the two diverge. When the incumbent party has ultimately won, on average, the fall correction has been brief and shallow, followed by a strong fourth-quarter rally. When the incumbent party has lost, the fall correction has been longer and deeper, and the year-end rally less pronounced. In addition to the impact on investor sentiment, the divergence during the second half of the year likely reflects economic conditions. The stock market discounts economic conditions, so both are affected by the health of the economy. As a result, the more pronounced weakness during the second half of election years when the incumbent party has lost could have been reflecting poor economic expectations. Conversely, during years the incumbent party retained the presidency, the stock market's second-half strength could have been discounting a robust economy. Using a Bureau of Economic Research recession within 12 months of the election as the definition of a weak economy, the economy picked whether the incumbent party won or lost in 10 of the 15 post-WWII elections. A "correct" pick is defined as either the incumbent party losing and a recession within 12 months of the election, or as the incumbent party winning and no recession within 12 months of the election. The cliché that Americans vote with their pocketbooks appears to be true; or as President Clinton's 1992 campaign slogan put it, "it's the economy, stupid!" Does The Market Care Who Wins? Is the market's preoccupation with which party is in power warranted? History suggests that the answer is no. Figure 3 breaks down the DJIA's gain per annum (GPA) by which party is in control of the White House and Congress. The DJIA has risen almost twice as fast during Democratic presidencies, with a 7.2 percent GPA versus the Republican GPA of 3.8 percent. But after taking inflation into account, the differential almost disappears. The real GPA has been 2.5 percent under Democratic presidents versus 2 percent under Republicans. The bottom rows of Figure 3 subdivide the returns by both presidential and Congressional leadership. The highest real DJIA GPA has occurred during a Democratic president and Republican Congress. One conclusion from this data is that the market has performed best during gridlock, when checks and balances have been strongest and neither party has been able to advance its agenda. What About This Year? As of this writing in mid-February, the economy and stock market have generally followed the election cycle script:
If the monetary and fiscal stimulus saves the economy from recession, the majority of the stock market weakness is probably behind us - a positive development for John McCain, the Republican nominee (see Figure 2). However, a prolonged economic contraction would likely result in another down leg for the stock market, something that is likely to bolster the Democratic nominee. The irony is that for all the candidates' talk about change, the best case for the stock market, at least historically, is for there to be enough gridlock in Washington that politicians stay out of the way and let the economy and stock market manage themselves. |
 |
 |

 The Federal Reserve was granted independence for precisely this reason - Congress recognized the negative long-term consequences of politically motivated monetary policy. Perhaps the Fed's friendliness is the result of the unspoken knowledge that Congress could revoke the Fed's charter. More likely it's the Fed's response to economic conditions. Either way, the Fed has tended to be friendly, rather than hostile, leading into an election.
 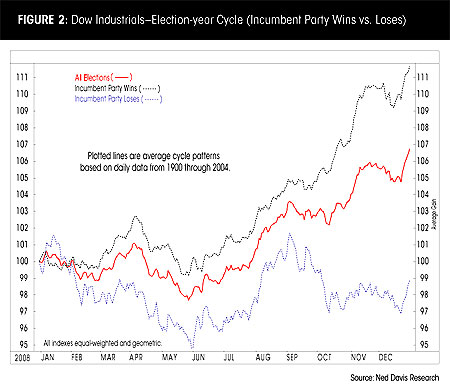 Attitudes toward the presidential race are one component regarding how investors feel about the market, also called investor sentiment. The stock market is the manifestation of group psychology in motion. When investors as a group are extremely optimistic, all those who are likely to own stocks have already bought, leaving few additional buyers. Conversely, when investors are extremely pessimistic, the nervous investors have already sold, leaving only those with the strongest conviction. A major driver of sentiment is uncertainty. Investors fear the unknown, so more ambiguity tends to coincide with higher levels of pessimism. Until the winner of the election is certain, the political cloud hangs over the market.
 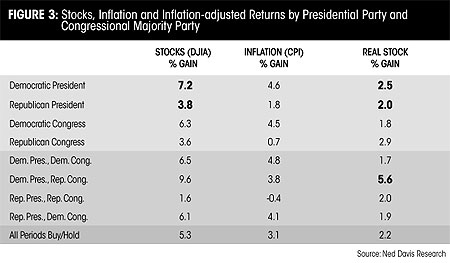 In addition, the U.S. dollar has tended to respond to the monetary and fiscal stimulus, bottoming at the beginning of the election year. The uptrend has generally continued into the third quarter of the postelection year.