
Send this article to a friend:
December
18
2017

|
Send this article to a friend: December |
|
WORLD SILVER PRODUCTION: 3 Charts You Won’t See Anywhere Else
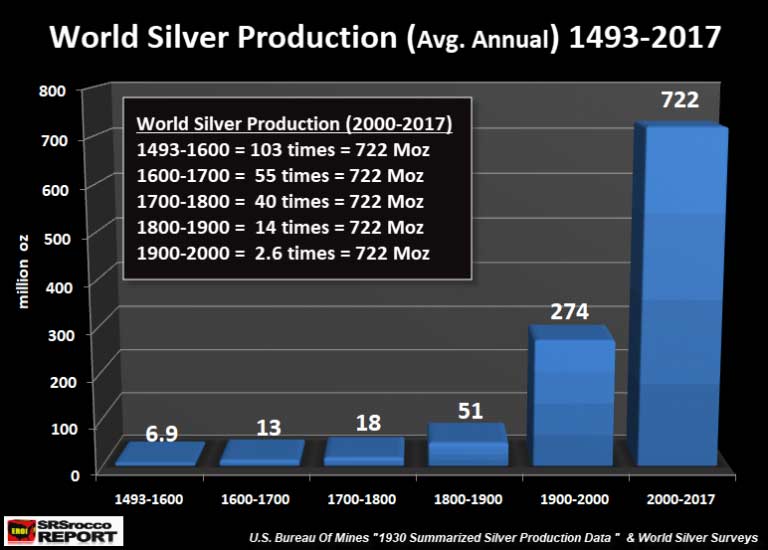
Today, the world’s largest primary silver mine, Fresnillo’s Sauicto Mine, produced three times that amount in just one year (22 million oz, 2016). Yes, we have come along way in 500 years. Just think about that for a minute. One silver mine last year produced three times the global amount in 1493. According to the U.S. Bureau of Mines 1930 Report on Summarized Data of Silver Production, the average annual silver production in the world from 1493 to 1600 was 6.9 million oz (Moz). If we look at the following chart, we can see how world silver production increased over the past 500+ years:
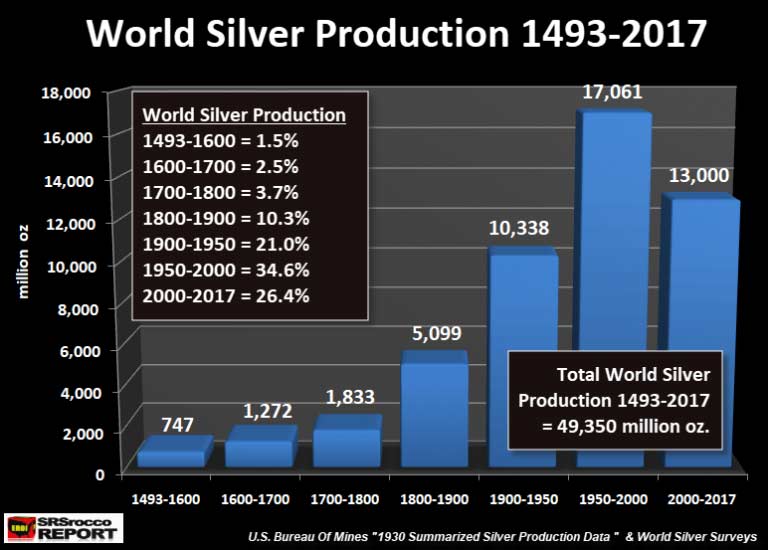
As we can see, average annual world silver production increased from 6.9 Moz during 1493-1600, to 13 Moz from 1600-1700, 18 Moz from 1700-1800, 51 Moz from 1800-1900, 274 Moz from 1900-2000 and a stunning 722 Moz from 2000-2017. Again, these figures represent the average annual silver production for each time period. In the current period, 2000-2017, the world has produced 103 times more silver per year than from 1493-1600. However, the next chart shows the total silver production for each period. From 1493-1600, the world produced a total of 747 Moz of silver, compared to 13,000 Moz (13 billion oz) in just 18 years from 2000-2017:
Now, the reason the last silver bar on the right of the chart is lower than the previous one has to do with comparing 18 years worth of silver production (2000-2017) versus 50 years (1950-2000). It took 50 years to produce 17,061 Moz during 1950-2000 versus 13,000 Moz in the 18 years from 2000-2017. If we compare world silver production from the different periods, here is the result: Percentage Of World Silver Production (1493-2017)
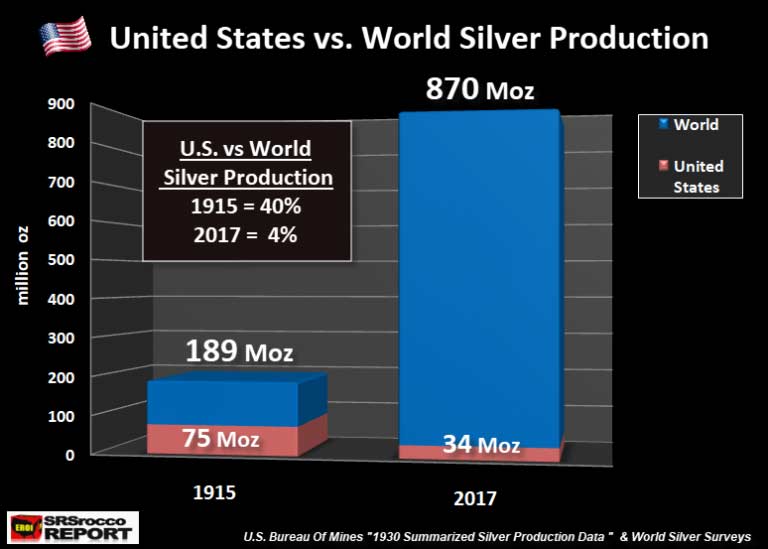
While a little more than a quarter of all world silver production (1493-2017) was produced in the past 18 years, 82% was produced since 1900. That is a lot of silver. It turns out that 40.4 billion oz was produced from 1900-2017 out of the total 49.3 billion oz produced since 1493. Interestingly, more than half of that silver was consumed in industrial silver applications. I will be writing more about that in future articles. The last chart I find quite interesting. If we go back a little more than a century, the United States was the largest silver producer in the world. In 1915, the U.S. produced 75 Moz of silver out of the total 189 Moz mined in the world that year:
Thus, in 1915, the U.S. produced 40% of all world silver production. Mexico came in second in 1915 by producing 39.3 Moz. However, U.S. silver production in 2017 will only be 34 Moz versus the estimated 870 Moz globally. Thus, U.S. silver production only accounts for 4% of world mine supply versus 40% back in 1915. What a change in 100 years. Lastly, the U.S. imports approximately 22% of world mine production each year. That is 193 Moz of the total 870 Moz in 2017. While domestic mine supply is only 34 Moz, the United States has to import more than a fifth of global mine production to meet its silver market demand.
My goal is to reach 500 PATRON SUPPORTERS. Currently, the SRSrocco Report has 155 Patrons now! Thank you very much for those who became new members and new Patrons of the SRSrocco Report site. So please consider supporting my work on Patron by clicking the image below:
Or you can go to my new Membership page by clicking the image below:
Check back for new articles and updates at the SRSrocco Report. You can also follow us on Twitter, Facebook, and Youtube below:
|
Send this article to a friend:
 |
 |
 |


![[Most Recent Quotes from www.kitco.com]](http://www.kitconet.com/charts/metals/gold/t24_au_en_usoz_2.gif)
![[Most Recent USD from www.kitco.com]](http://www.weblinks247.com/indexes/idx24_usd_en_2.gif)
![[Most Recent Quotes from www.kitco.com]](http://www.kitconet.com/charts/metals/silver/t24_ag_en_usoz_2.gif)