Inflationary Wonderland
Gary Tanashian
 Inflation has permeated the macro markets; where to from here? Inflation has permeated the macro markets; where to from here?
Apologies in advance for some of the possibly confusing content to follow. But if this were easy anyone could do it, eh?
There are a lot of balls in the air; balls known as inflation vs. deflation and most of all time frames.
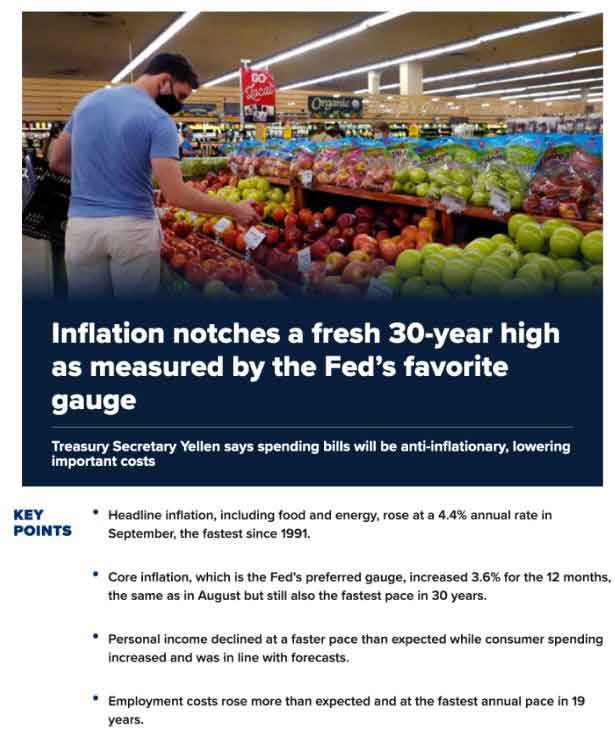
The media present inflation as this guy picking out higher priced fruit. Wait til he gets to the meat department! You can click here for the article at CNBC.
Meanwhile, the Biden administration’s Minister of (financial) Information, Janet Yellen, informs us that all that cost-pushed inflation about to be shoved into the economy is actually going to be anti-inflationary as it actually lowers some costs (in Wonderland anything is possible).
Treasury Secretary Yellen says spending bills will be anti-inflationary, lowering important costs
Speaking from Rome, she insisted that “what this package will do is lower some of the most important costs, what they pay for health care, for child care. It’s anti-inflationary in that sense as well.”
Okay, those are noble goals. But Janet please, in order to be completely transparent you must rephrase thusly…
“What this package will do is lower some of the most important costs, what they pay for health care, for child care. We are taking the inflation already created (printed) by the Federal Reserve, which added more monetary units per finite assets, services, basic goods and human resources and we have selected within that our favored areas for benefit. Then you see, we are able to tout the wonderful things we are doing for specific beneficiaries while the inevitable tax is shoved (cost-pushed) into the general economy and the population at large pays the price of this beneficial action to specific areas. So come to think of it, let me just say that we are sweeping inflation under the rug here and delivering it there. It’s really a zero sum game but WTF do you want me to say publicly? Okay, we’re all screwed and the Fed is putting itself in a box; a dangerously small box.“
And speaking of a boxed in Fed, let’s remember two things:
- The Fed will not incinerate itself in an inflationary bonfire by willingly delivering more of it if/when inflation expectations get out of control (to this point they’ve been amped but not yet out of control; it goes to 11 but we’re probably at 8). The Fed inflates under cover of deflation, not with a backdrop of already manufactured inflation and associated cost effects.
- There is room by one indicator for more inflationary economic pressure before the Fed goes completely steroidal in its inflation fighting stance.
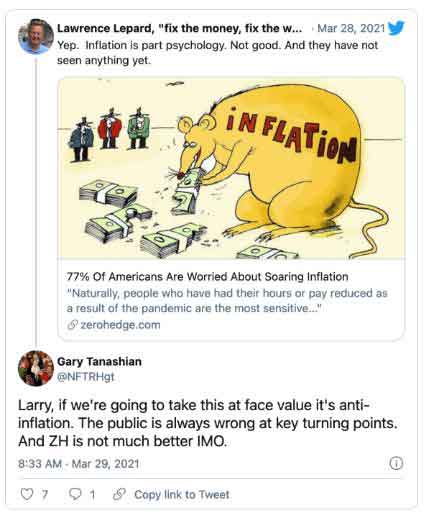
Here is the first inkling that the cool down was coming last spring, unwittingly provided by Zero Hedge.
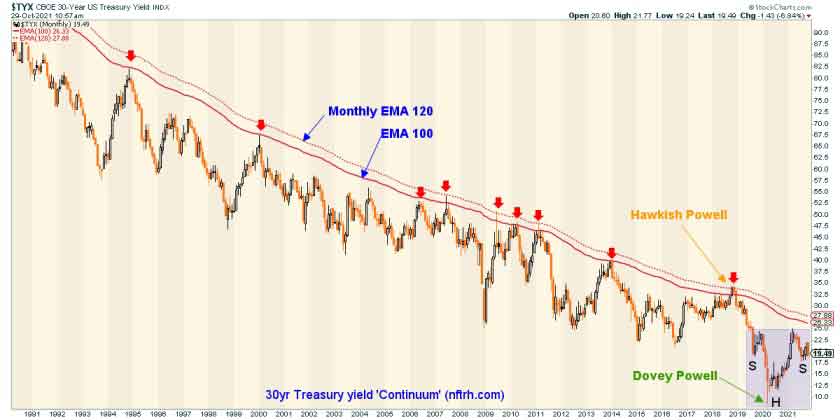
That indicator, as usual in the NFTRH financial world view, is the simple monthly chart of the 30yr Treasury yield Continuum. The brief history of our analysis for 2021 with respect to this chart has been as follows…
- Anticipated the ‘summer cool down’ as inflation expectations ramped too high too fast in the spring (as the Continuum dinged 2.5% on the 30yr yield).
- Anticipated a return of the inflation trades after said ‘cool down’ cooled things down (as the Continuum formed a roughly symmetrical right side shoulder to the left side).
And here we are with a theoretical Inverted Head & Shoulders pattern in the making that would set the yield up for a test of the EMA 100 and/or 120 (red lines), which have limited all such inflationary phases over several decades. But we are also at a new and much more abrupt cool down point. This cool down point may well serve to temporarily back the Fed off a bit from its turn toward being sterner on inflation in recent weeks.
Assuming a continuation of the inflationary macro in the near-term (see chart below for the support area to that notion), at the red limiters on the chart above there is a decision with these possibilities (listed in order of probability, with 1 & 2 at nearly even odds in my opinion).
- Failure of the inflation like several times before into a disinflationary and likely deflationary situation (that which is created by will of man liquidates against will of man). Signaled by a halt and failure by the Continuum at or around the limiters (again, if the inflation trades are not unexpectedly ending here and now) and a chronically strong USD, which is in an uptrend for all of 2021 as an ongoing negative divergence to the inflated macro, and would gain liquidity bids when the inflation fails.
- A more virulent inflation, Stagflation to be precise, where rising costs start to impair the economy to the point of an economic halt and/or deceleration. Signaled by a definitive breakout above the limiters to a target we are managing in NFTRH. von Mises, anyone?
- A return of the blessed ‘not too hot, not too cool’ Goldilocks backdrop, with a chronically firm US dollar (see USD 2021 uptrend per the link in bullet #1) and domestic, non-cyclical, non-reflation sensitive areas benefiting disproportionately. In other words, areas that benefit from a firm domestic currency.
‘But Gary, that is just one chart of one long-term Treasury yield you are trying to use as a one size fits all macro projection!’
Right you are dear imaginary critic.
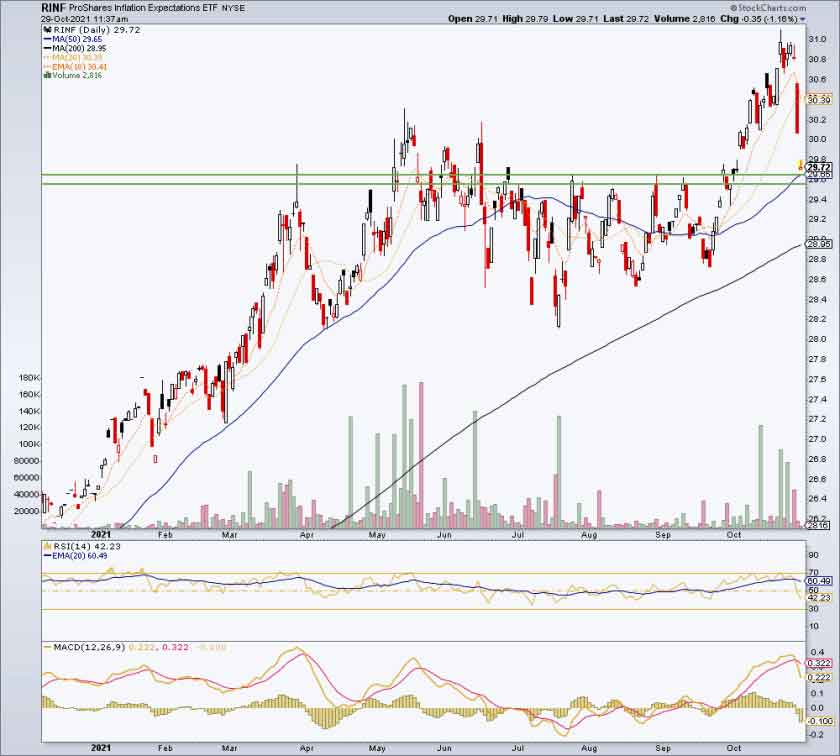
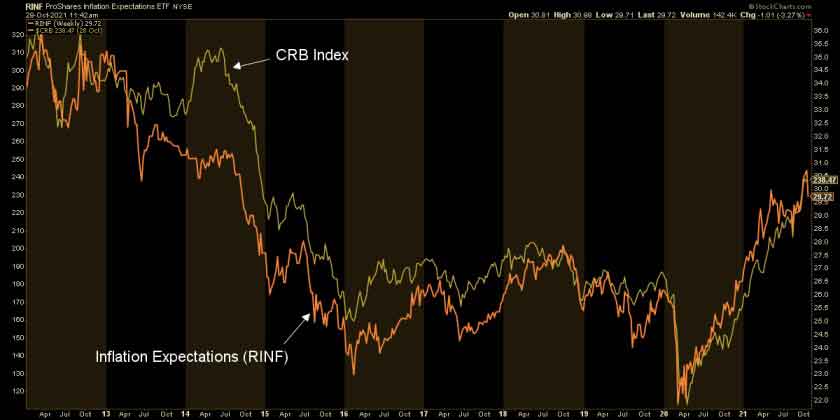
So let’s note just one of several other ways of gauging inflation. Today, on let’s call it Inflation Hysterics Friday, the Inflation Expectations ETF is tanking to an important support area. The monthly chart above is all well and good for the big picture view, but this picture tells us that the inflation trades are intact but getting a hell of a good test, conveniently with FOMC meeting next week. I have long viewed the Fed as a cynical and self-conscious entity with respect to the inflation it routinely manufactures. This pullback could help the committee maintain some appearance of credibility.
If you think that is just a chart with limited meaning for your inflation trades, think again. As we note nearly every week in NFTRH, RINF and the CRB index go in lockstep. There is no one without the other.
Here is the chart that often appears in the Commodities segment for your consideration. It ain’t broke ’til it’s broke, but right minded market participants are staying open to all possibilities from here on and hopefully tuning out the media as well. I look forward to managing the process ever more closely each week in NFTRH. It’s what separates effective speculators and risk managers from the herd.
Now offering a 2 week free trial to the NFTRH Premium service with no obligation whatsoever. Sign up by PayPal, enjoy 2 free weeks of on-point market management and if it is not for you, cancel at any time with no further obligation. When you find that it is for you, stay on for as long as you like and let’s manage and take advantage in a cold and rational way as we head toward 2022 and its new macro challenges. 1st time subscribers only please.
For “best of breed” top down analysis of all major markets, subscribe to NFTRH Premium, which includes an in-depth weekly market report, detailed market updates and NFTRH+ dynamic updates and chart/trade setup ideas. Subscribe by PayPal or credit card using a button on the right sidebar (if using a mobile device you may need to scroll down). Keep up to date with actionable public content at NFTRH.com by using the email form on the right sidebar. Follow via Twitter @NFTRHgt.

Gary Tanashian of nftrh.com successfully owned and operated a progressive medical device/equipment/component manufacturing company for 21 years, keeping the company’s fundamentals in alignment with global economic realities through various economic cycles. The natural progression from this experience is an understanding of and appreciation for global macro-economics as it relates to individual markets and sectors.
Biiwii.com was created in 2004 as a way to help communicate a message about deeply rooted problems with too much debt and leverage within the inflated financial system. Our concerns were confirmed and our message justified in 2007 as the system began to purge these distortions, resulting in a climactic washout extending from October, 2008 to March, 2009. But one manifestation of the boom/bust cycles hard wired into a Keynesian monetary/economic system.
nftrh.com
| 

![[Most Recent Quotes from www.kitco.com]](http://www.kitconet.com/images/live/s_gold.gif)
![[Most Recent USD from www.kitco.com]](http://www.weblinks247.com/indexes/idx24_usd_en_2.gif)
![[Most Recent Quotes from www.kitco.com]](http://www.kitconet.com/images/live/s_silv.gif)