What Happens When You Stomp The Gas and the Brake Simultaneously?
Pro-cyclical Trump / Congress vs. Counter-cyclical Fed
Chris Hamilton
 Fiscal Conservatism is Dead - Surging Government Spending Coupled with Tumbling Tax Receipts Are Fiscal Populism Fiscal Conservatism is Dead - Surging Government Spending Coupled with Tumbling Tax Receipts Are Fiscal Populism
Many American's believe in a simple idea called fiscal conservatism. Low taxation coupled with low government spending and low (or reduced) government debt. However, the nations leadership (executive and legislative branches) have fallen in love with the idea of spending tax money you and I haven't made yet.
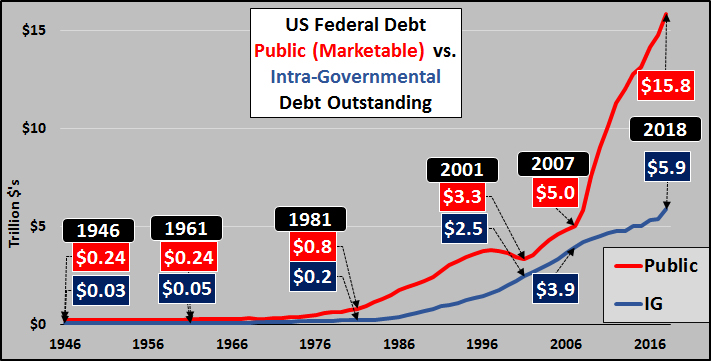
The chart below breaks down the current $21.7 trillion federal debt into publicly traded Treasury's outstanding (marketable) and that which is purchased by America's Social Security and like trust fund surpluses known as Intra-Governmental debt.
Clearly, since 2007, marketable debt is soaring while trust fund surpluses are waning and will soon turn to outright sellers. Fairly soon (early 2020's), all net debt issued will be marketable...and with the fast growing size and cost of servicing that debt, interest payments will consume ever more of the tax revenue the government collects.
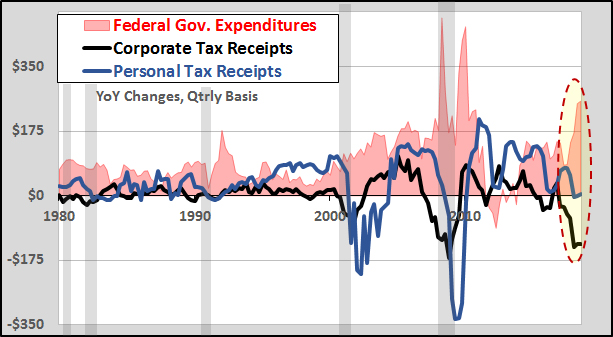
That the current administration (like decades of their predecessors) are not fiscal conservatives should come as no shock. But, the current Congress and president have embraced a policy that should be termed as "fiscal populism". If you notice in the circled area on the far right of the chart, you will see the large declines in corporate tax revenue and also the zero growth in personal tax revenue. However, the kicker is the parallel surge in federal government spending...driving that federal debt (above) vertical.
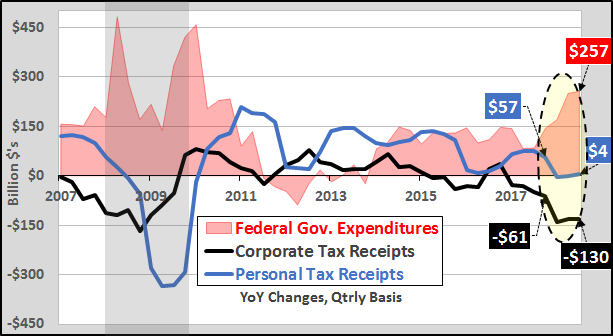
The chart below is the same as above but showing only 2007 through Q3 2018.
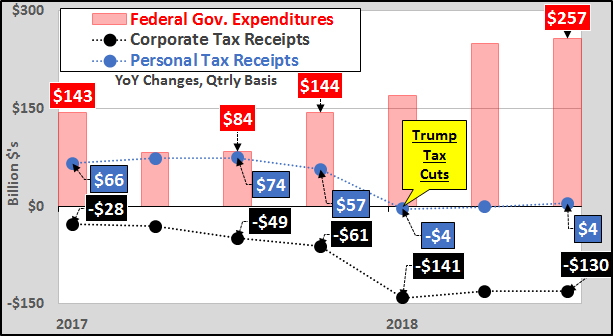
Again, same as above but showing 2017 through Q3 2018. The Trump tax cuts took effect in Q1 of 2018 and the large year over year declines in corporate tax revenue were expected but perhaps not the zero growth in personal tax revenue. Simultaneous to the tax cuts were large year over year increases in federal government spending (fiscal conservatives they ain't).
The last chart details the never before seen (at least post WWII) divergence of counter-cyclical monetary and pro-cyclical fiscal policy. Red columns are the quarterly year over year change in federal spending plus year over year change in federal tax revenues (increases in federal government spending and federal tax revenue decreases shown together as stimulus...decreases in spending and rising tax revenue shown as economic constraint). Blue line is quarterly year over year change in the Federal Funds interest rate.
Until now, increased federal spending coupled with lower tax revenue collected act as an economic stimulant typically in sync with interest rate cuts. However, the president and Congress are undertaking large spending increases and reducing taxation to gas the economy (typically in-line with the onset of an economic crisis) while the Federal Reserve is moving in a pro-cyclical direction raising rates (plus selling off $50 billion/month from it's balance sheet) in an attempt to stomp the brakes on the economy.
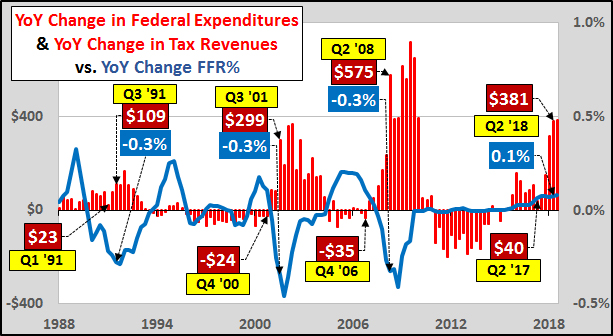
These two parties are clearly not on the same page and likely to only get further apart. The Fed has committed to continued rate hikes and balance sheet reduction while the president / Congress continue to increase federal expenditures and are even discussing additional tax cuts, particularly targeting a reduction in personal taxes (of course, perhaps this is only pre-election jawboning).
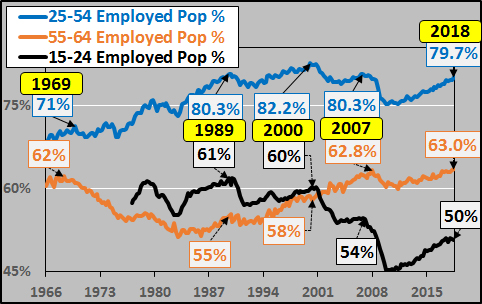
BTW - Given that the US is rapidly closing in on full employment (regardless the quality)...hard to understand why further stimulus would be a good idea given there will essentially be no more people willing or able to enter the workforce.
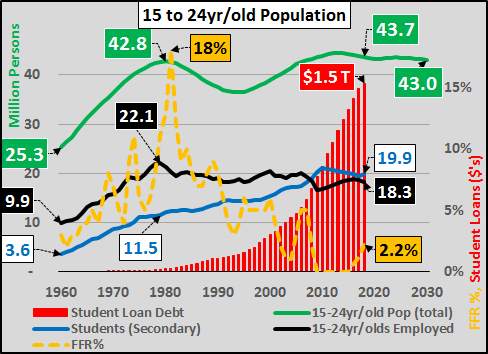
And why that low 15 to 24 year old employment ratio isn't about to rise much further. Chart below shows the declining 15 to 24 year old population (green line) and the rise of the student class (blue line) over the working class (black line) and the total student loan debt undertaken to do so (red columns).

Chris Hamilton is author of the blogspot https://economica.blogspot.com He lives in Oregon with his family, after having worked for Nike and Adidas for nearly 20 years, including expat tours in Taiwan, S. Korea, and Germany. Following the global financial crisis, he had questions about our financial and economic system and found the conventional wisdom offered incomplete and inadequate. After a decade of research and investigation, Chris has made the case for an alternative narrative of what ails the global economy...although the solutions are far more elusive. In his blog he brings some interesting and novel insights into the U.S. economy, the Fed, and politics.
econimica.blogspot.com
| 


![[Most Recent Quotes from www.kitco.com]](http://www.kitconet.com/charts/metals/gold/t24_au_en_usoz_2.gif)
![[Most Recent USD from www.kitco.com]](http://www.weblinks247.com/indexes/idx24_usd_en_2.gif)
![[Most Recent Quotes from www.kitco.com]](http://www.kitconet.com/charts/metals/silver/t24_ag_en_usoz_2.gif)