|
|
Are Financials on the Verge of Disaster?
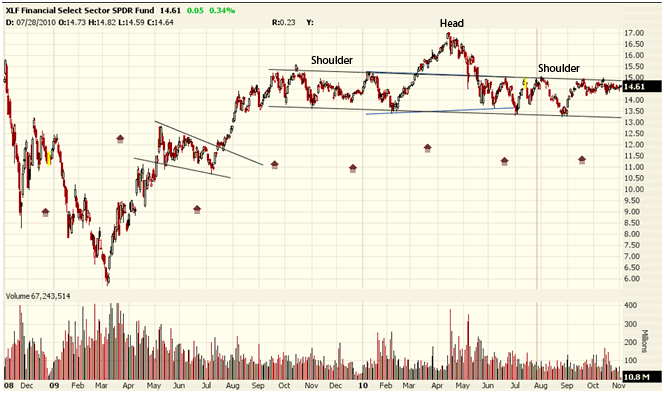
The financials got us into this mess...and they may drag us right back into it. We seem to have to forgotten how bad things were with banks and financials a few years ago. Lehman, Bear Stearns, and a multitude of banks went bankrupt; the problems at the root of this debacle were still not fully dealt with; financial stocks are lagging; and Wall Street bonuses are still setting records! Financial stocks took such a beating that anyone who bought Bank of America (BAC), Goldman Sachs (GS), Citigroup (C), JP Morgan (JPM), or any among a huge selection of other financials, has seen his or her returns exceed hundreds of percents! With a market that, on average, returns about 8 percent a year, having the largest financial stocks resurrected and returning 200 to 1000 percent is unheard of! But as financials rebounded, carried the market back up, and eased the economy from its extreme panic of 2008, it did so by sweeping all the problems under the rug. By pushing off many of the issues concerning the lack of transparency, complicated and dangerous derivatives (such as mortgage-backed securities), and the utter disregard for their investors and the economy as a whole, all the financials ended up doing is buying more time. And as that time runs out, and reality starts to set in, the panic will once again follow. Take a look at a chart of the (XLF), an ETF that measures the financials as a whole. After dropping from over $34 in 2007 to under $6 in 2009 (an over 80 percent drop!), the financial sector rebounded strongly to a high of about $17 in April 2010. Such an almost-perfect rebound gave the market some confidence for a while; but as anxiety sets back in now, there may be a chart-pattern that warns us of potential collapse.
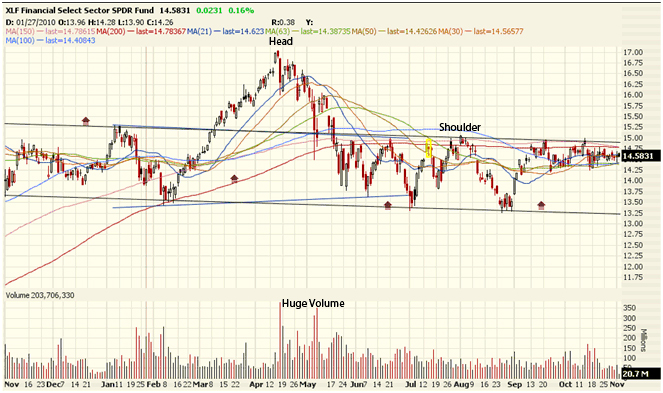
First off, regardless of the pattern we will discuss, it is important to notice that the financials have actually been lagging the overall market over the past few months. While the S&P 500 has seen double-digit gains over September and October, the financials (XLF) have been struggling to break out of their range. Looking at the chart above, you can see the nice run-up the financials had from their March 2009 low to the April 2010 high. But along the way, and following the April-August downturn, it appears financials have formed an almost-deadly pattern. The head and shoulders pattern now stands in the way of a financial growth period. The head and Shoulder pattern is a reversal pattern that generally appears at the end of a big market move. In our case, after the huge run-up in financials off of the 2009 panic bottom, the head and shoulders pattern has formed and may be on the verge of confirming a new recession. Taking a look at the pattern, we can see investor emotions. The first shoulder on the left represents the first instance of investor anxiety within the pattern. As investors realized that financials have had such a huge run from March 2009 up to that point in October 2009, fear about a potential fall prompted some investors to sell their stake. But there were others who ended up buying the dip, which found its low in February 2010. Those who bought the dip in financials helped start another run-up that ended up seeing new highs in April 2010 - This run-up represents increased investor confidence that financials may be recovering and carring the market further. After the second round of buyers and sellers made their move, however, a new group of sellers came in and realized Finacials may be overbought here again in April 2010. If financials were sold off in October 2009 when the price was even lower, why should they continue to rise in April 2010 at a higher price? For that reason, along with extreme anxiety concerning the Goldman Sachs case as well as the BP oil spill troubles, sellers came back into the market in droves! If you take a look at the Volume in April and May, you'll see the bars are much bigger at that point that at any point since around the March 2009 low. Such high volume in selling shows us some capitulation by investors and conviction in the downward move.
And following that capitulating downward move from the top, some investors bought up the financials in hopes of new highs. The emphasis there is on "HOPE": the right shoulder in a head and shoulders pattern represents the last group of investors who jump into the stock at the end, as the upwards move is on the verge of its termination. Most of these last investors were bullish for the market, optimistic for the financials, and in desperate search for new-found profits. But they may have waited too long, and may have jumped in too late. This last run-up may be the last-ditch-effort in the financials. So what happens from here? The shoulders (of which we have multiple instances on both sides of the head) are big resistance levels. That said, as price approaches the top of the shoulder now (at around $15 on the XLF), it is projected to fail to break above that level. It will then start falling down toward the bottom of the pattern (called the neckline). If it fails at $15, falls down toward the neckline, and breaks through the bottom - it will signal the confimation of the head and shoulders pattern. The breakthrough of price out of the bottom of the formation will signal a huge upcoming drop in the financials, which will in turn drag the market down with it. This head and shoulders pattern not only signifies the anxiety and potential panic that may follow as the market unravels, but it helps us examine and understand that human element that has been embedded within the charts. When we understand the circumstances surrounding the economy and the financial sector in particular, and then we see those situations unfold in the charts, we can make a much better bet on the market's future direction. In our case, it appears that the financial rebound, although huge and hope-inciting, may be quickly fading. After an almost 600 percent run-up since the March 2009 lows, the problems that were "swept under the rug" are beginning to resurface. And together with a massive head and shoulders pattern that is on the verge of reversing, this market may be setting up for a double-dip back into recession; and this time it won't be as easy to get out of. Disclosure: No current positions |
 |
 |