
Send this article to a friend:
October
13
2022

|
Send this article to a friend: October |
|
Market Indicators That Suggest A Precious Metals Rally May Be Imminent
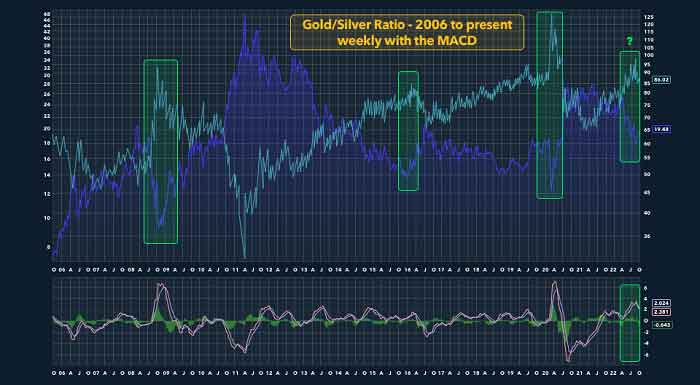
In addition to the gold/silver ratio, some interesting, lesser-followed market indicators suggest the possibility that the precious metals sector may be forming an investable bottom. The chart below shows the gold/silver ratio (GSR) from late 2006 to the present on a weekly basis. Periods when the GSR has risen above 80 (as indicated by the green boxes) are followed by a sharp decline in the GSR and a rally in the precious metals sector.
Gold/Silver ratio from late 2006 – present (weekly) Currently, the GSR has rolled over from reaching its third highest level since 2008 and by far the highest level since August 2020, when the current down-cycle in the precious metals sector began. In addition, the MACD – or the moving average convergence divergence – hits its third most overbought reading in the time period shown in the chart. It has rolled over and is pointing to the possibility of a downturn in the GSR. In addition to the GSR potentially signalling a big rally in the precious metals sector, certain indicators suggest that the physical supply of silver is getting tight. First, at the beginning of September silver lease rates spiked up to their highest level since 2008, with the lease rate for gold also rising considerably. Lease rates rise when there’s a more immediate demand for deliverable gold or silver than there is supply available for immediate delivery. Certain entities, primarily banks, will lend out their metal to entities that require immediate availability. The transaction requires the borrower to put up cash collateral with the lessor. However, when supplies are tight, it requires a higher lease rate to induce banks to lease their metal. Typically a rising lease rate is followed by a rally in gold and silver. The LBMA no longer publishes the official lease rates, but Monetary Metals uses a formula based on the same variables used by the LBMA. You can track the lease rates here: Monetary Metals Lease Rates. Another indicator reinforcing the view that the supply of physical silver is getting tight in the global market is the movement of silver bars out of LBMA and Comex vaults. As detailed by Ronan Manly, the stockpile of silver in LBMA vaults has been declining since late 2021. At the end of June 2022, the LBMA silver inventories hit a six-year low. Through August, the LBMA silver vault inventory hit an all-time low going back to when the data was made public in 2016. Part of this has been a resurgence in India’s importation of physical silver – although, this only explains a portion of the decline. Since late June, the registered silver stock at the Comex has declined by 26.3 million ounces. Up until recently, this silver was simply moved out of the registered designation into the eligible designation for safekeeping. However, in the last few weeks over 16 million ounces have been removed entirely from the Comex vault system through September. Is Gresham’s Law taking effect in the precious metals sector? If so, this is extraordinarily bullish. The last indicator is the SLV ETF. The short interest in SLV has risen to over 11% of the float. This is historically an extreme high for the SLV interest. The cost to borrow SLV shares has shot up from 0.18% in late June to over 4%. There are a few theories for this development. The most reasonable in my opinion is that hedge funds, which are now net short Comex silver futures contracts (gross long position less their gross short position) per the weekly CME COT report, have supplemented their futures shorts with SLV shorts. At the same time that the hedge funds went short Comex futures (and, likely short SLV), the Comex market maker banks became net long Comex silver futures. Historically, the precious metals sector moves into a bull market cycle in the months following periods when the Comex banks have become net long at the same time as the hedge funds have become net short. Do the banks know something?
investmentresearchdynamics.com
|
Send this article to a friend:
 |
 |
 |

![[Most Recent Quotes from www.kitco.com]](http://www.kitconet.com/images/live/s_gold.gif)
![[Most Recent USD from www.kitco.com]](http://www.weblinks247.com/indexes/idx24_usd_en_2.gif)
![[Most Recent Quotes from www.kitco.com]](http://www.kitconet.com/images/live/s_silv.gif)