
Send this article to a friend:
October
06
2018

|
Send this article to a friend: October |
|
How Commodities Will Perform In The Impending Massive Credit Crunch...
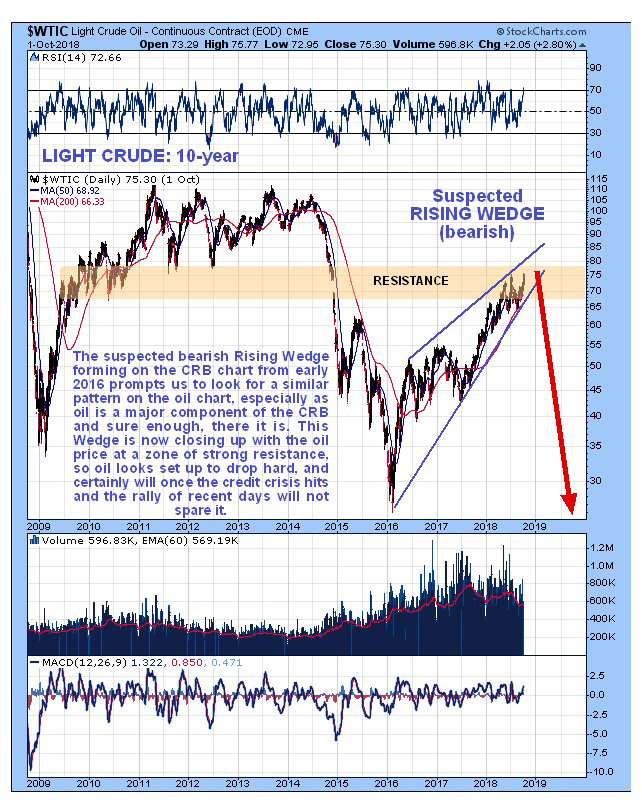
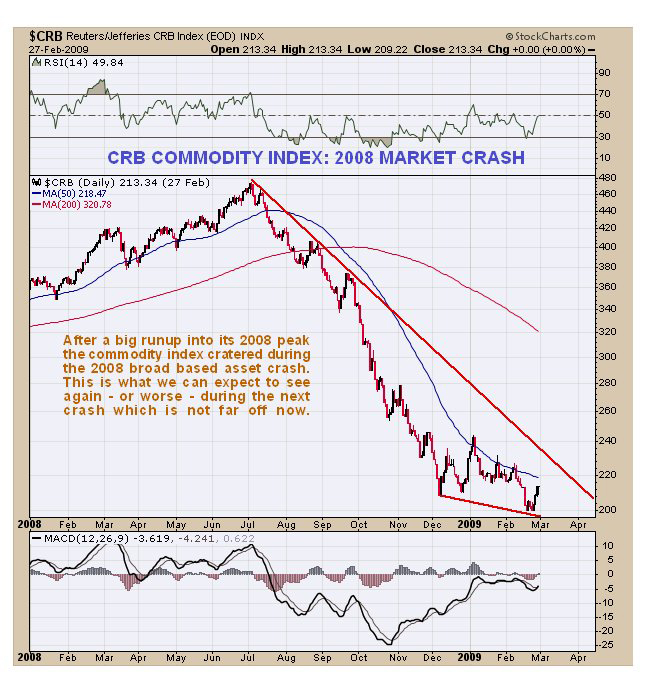
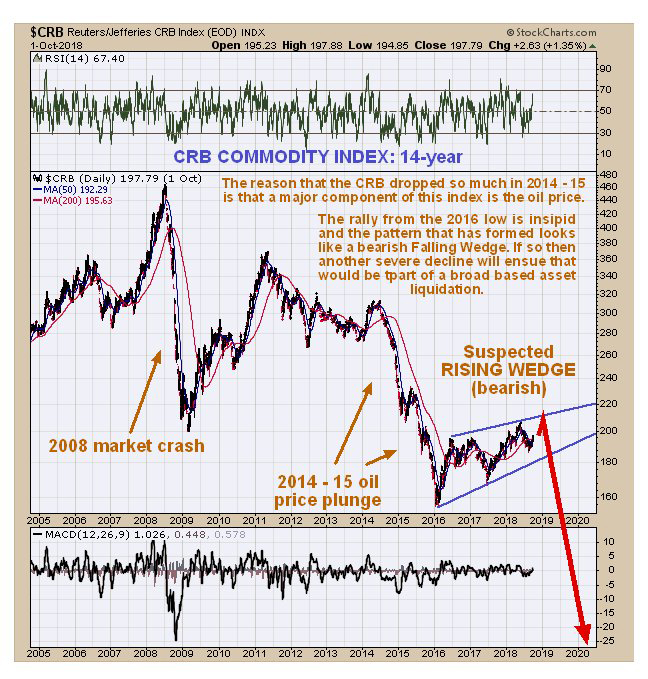
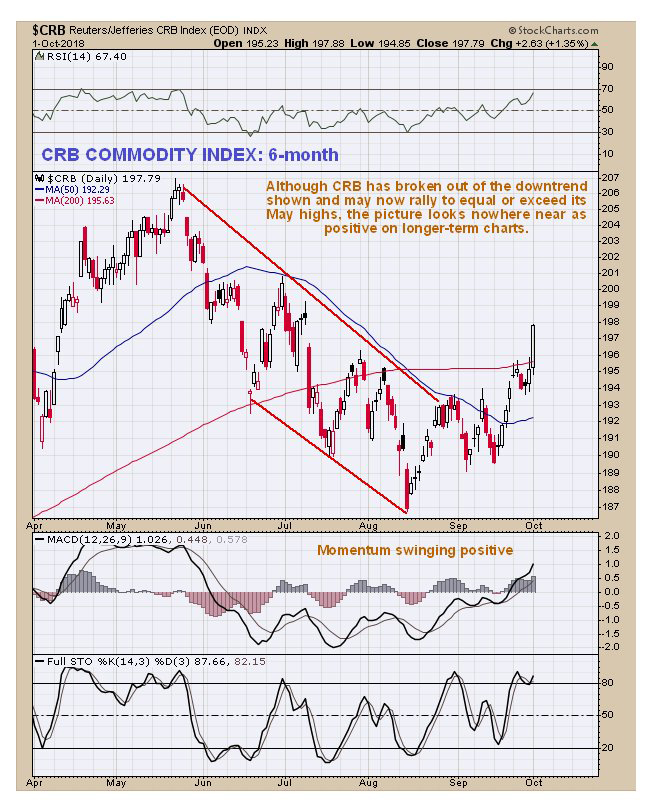
This is probably the high point for Trump’s Presidency as the stockmarket enjoys its final “swansong rally” ahead of the crash, buoyed up the last of the stock buybacks before rising rates choke them off, and the dumbest of the dumb money who think that because the market has been in an uptrend for years it’s going to continue. The Fed has been playing a stealth game for a long time now, gradually but steadily raising rates and hoping that the market won’t notice, and also furtively offloading its Treasury hoard, and other Central Banks are following the Fed’s lead and doing likewise. The liquidity that drove the massive bubbles in Real Estate and stockmarkets is being pulled. That must inevitably lead to these markets dropping, and we are already seeing the start of it with the Emerging Markets plunging and hitherto red hot Real Estate markets cooling. When punters realize that the game is over, the decline is likely to become disorderly and involve a number of crash phases. The Fed is always behind the curve and reactive. It has been undermining the markets for over a year now with its raising of interest rates and now QT, so when the markets buckle and cave in, it won’t be “something out of the blue” or an “Act of God” as the mainstream media will inevitably portray it, it is eminently predictable, and slated to happen soon. The reason that the Fed and other Central Banks are raising rates and withdrawing liquidity is that they know there is another mammoth crisis looming, and they are scrambling to buffer themselves ahead of it, by giving themselves “wiggle room” to lower rates, and scaling back their massive holdings of Treasury paper etc. The trouble is that it’s a very delicate balancing act, and they are inevitably overplaying their hand to the extent that their actions will bring about the crisis that they are seeking to avoid, or at least get ahead of. When you get up in the morning, you know that no matter how bright and strong the sun is around midday, night must later follow. In the same way bullmarkets are followed by bearmarkets, with the consolidation and contraction in the bearmarket phase of the market cycle being necessary to strip out excess and waste and cull the weak and inefficient. What has happened in recent years is that Central Banks and governments have intervened with their liquidity injections to artificially extend the bullmarket – a bearmarket should have started several years back – it is like a guy who has just finished a marathon being pumped with drugs and told to run another 10 miles. What this means is that when the bearmarket eventually does hit it arrives like a category 5 hurricane, which is actually what is called for now given the monstrous debt bubbles that have been inflated to gigantic proportions by all this relentless money pumping. Since what they have done in recent years amounts to pure lunacy according to normal criteria, we must ask ourselves “Why did they do it?” – the answer is twofold. The voting masses are economically infantile and reward politicians who give them what they want – what they want is endless prosperity and they will vote out any politician who threatens to inflict austerity on them, even if it’s for their own good. Secondly, the ZIRP policies of recent years have allowed for a massive transfer of wealth from the masses, the middle and lower classes, to the elites and super wealthy. The way it works is this – while the little folk continue to pay usurious interest rates to borrow money, the 1% pay almost nothing, borrow wads of cash and turn round and speculate in Real Estate, stockmarkets and other things like collectibles, driving huge bubbles in these markets, and then ideally cash out before the crash. Now, you might say, when the Fed and other Central Banks realize that they have pulled the plug on the markets with their liquidity drain, won’t they simply reverse course to stabilize the markets and pump them up again. Yes, of course they will, but by then it will be too late, as a self-feeding liquidation cycle will be going full bore, and any changes they make will need time to take effect. However, what will happen soon after they reverse course is that the dollar will suddenly find it has no wind in its sails, and gold and silver will skyrocket at the prospect of an unprecedented new round of QE that will have to be of staggering proportions to stabilize the ship, and will set us on the course to hyperinflation. This will be the point at which hapless citizens start to realize that what happens in Venezuela doesn’t necessarily stay in Venezuela. With a monstrous liquidity crunch bearing down on us, you don’t have to be a genius to work out what will happen to commodities. Look at 2008 as a dry run for what’s coming. Basically anything that can be sold for cash will be, and that will include commodities. It will only be when the Central Banks and governments reverse course into mega QE that commodities will quickly reverse and soar, especially the Precious Metals. Now we will look at some commodity charts to see how things are shaping up and to figure out what to expect. First though, we will go back to school with a review of what happened to commodities in 2008, as our example of what to expect, knowing that this time it should be worse. We’ll start with the general CRB commodity index, which has a big oil component, where we see on the chart for the 2008 crash that it got more than cut in half during 2008 and going into 2009. Not a great performance and the clearest of indications about what we can expect to see when the building liquidity crisis hits.
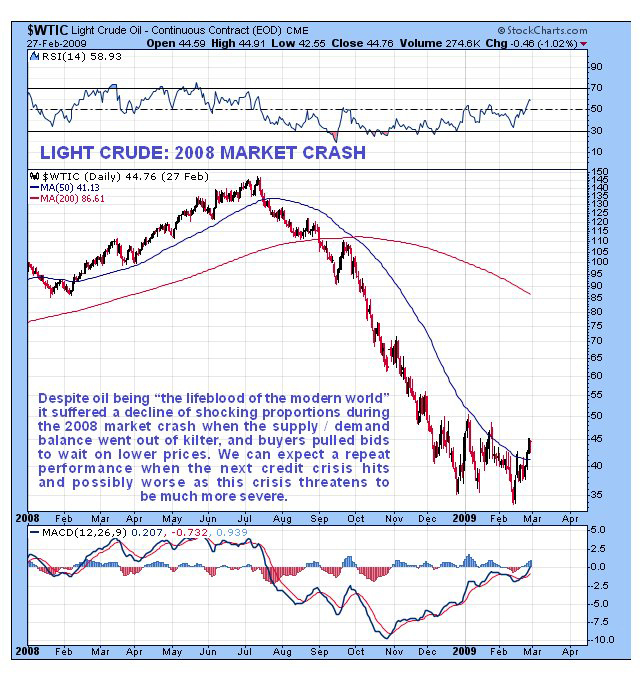
As for oil itself its decline during the 2008 crash was of a truly shocking magnitude, even with the benefit of 10 years’ hindsight – after all, oil is supposed to be the “lifeblood” of the modern world, is it not?
Finally, whilst we can’t be sure exactly when the stockmarket will turn tail and head south, we know that a savage bearmarket is drawing closer and we end with a look at a couple of many charts / indicators showing the market’s condition is extreme… First the number of indicators showing extreme pessimism and the number showing extreme optimism, is very skewed, showing that excessive optimism abounds…
|
Send this article to a friend:
 |
 |
 |

![[Most Recent Quotes from www.kitco.com]](http://www.kitconet.com/charts/metals/gold/t24_au_en_usoz_2.gif)
![[Most Recent USD from www.kitco.com]](http://www.weblinks247.com/indexes/idx24_usd_en_2.gif)
![[Most Recent Quotes from www.kitco.com]](http://www.kitconet.com/charts/metals/silver/t24_ag_en_usoz_2.gif)