
Send this article to a friend:
September
17
2025
|
Send this article to a friend: September |
The US dollar’s long-term cycle
The cyclical pattern outlined above began with an 8-year downward trend in the US$ (relative to the Swiss franc) during 1970-1978. This decline was followed by an upward trend that culminated in 1985 and then a 10-year decline to a major bottom in 1995. The following weekly chart picks up the story in 1991, which means that it captures the final few years of the 1985-1995 cyclical decline and everything thereafter. The chart shows that the most recent cyclical decline kicked off at the start of 2017, so it is not a coincidence that the last time we discussed this long-term cycle at TSI was in 2017. An 8-10-year decline from the 2017 high would result in the next major low for the USD being set during 2025-2027. Hence our comment above that a turning-point window has been entered. 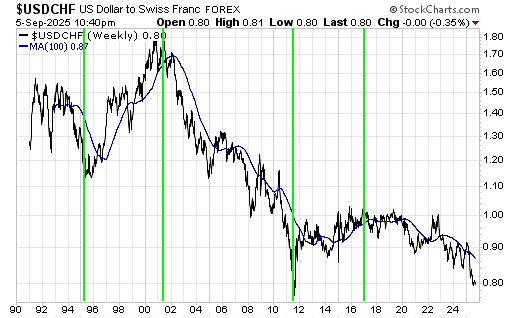
It’s worth pointing out that knowledge of the above-described cycle generally isn’t useful for practical trading purposes, because the countertrend moves during both cyclical uptrends and cyclical downtrends can be substantial. However, it is useful to know that previous cyclical downward trends, which culminated in 1978, 1995 and 2011, had large declines during their final 12 months. If this aspect of the long-term pattern repeats, then a large decline in the USD still lies ahead. So, where does this leave us? Our view at the start of this year was that the USD was about to embark of a 1-2-year decline to complete a cyclical downward trend. We subsequently refined this view and over the past several months have written that we expected a cycle low to be set late this year at not far below the early-July low. While we continue to expect that this year’s low will be not far below the early-July low, we no longer expect this year’s low to be the ultimate cycle low. Here are the three reasons in order of ascending importance: 1) As mentioned above, previous long-term declines in the USD have involved large declines during their final 12 months. Unless the USD loses about 10% of its value against the CHF within the next three months, the decline during the 12 months leading up to this year’s low will be minor in comparison. 2) Major USD lows have occurred at 16-17-year intervals (Q3-1978, Q2-1995, Q3-2011). The same interval projects 2027-2028 for the next major low. 3) Total US equity market capitalisation as a percentage of global equity market capitalisation reached a peak of almost 70% early this year. Refer to the following chart for the details. There is evidence in capital flow data and in the following chart that a reversal has occurred. Furthermore, the trade-related policies of the Trump Administration will tend to reduce capital in-flows at the same time as they restrict goods in-flows to the US, and US equity valuations are extremely high in both absolute and relative terms. A result is likely to be a multi-year period of weakness in US equities relative to global equities, which, in turn, would mean a multi-year period during which our US$ True Fundamentals Model (UTFM) spends most of its time in bearish or neutral territory. 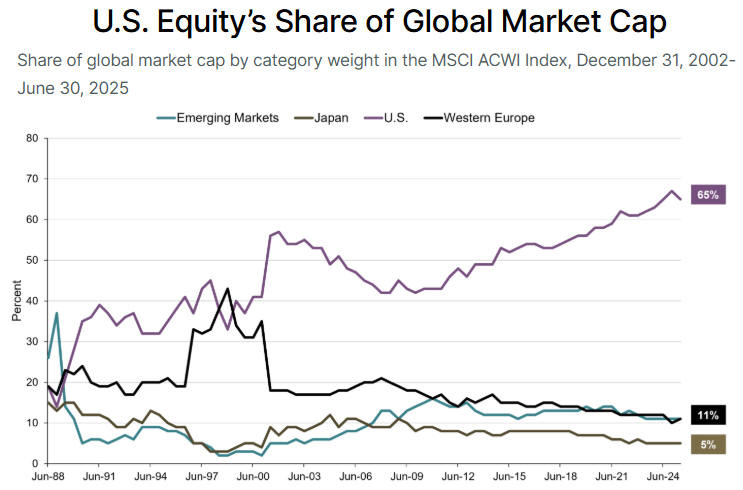
Chart source: Lord Abbett Further to the above, we expect that the USD will make an intermediate-term low before the end of this year, but the overall cyclical decline is now expected to extend into 2027. A cycle low in 2027 still would be within the window projected by the 6-8 years up followed by 8-10 years down repeating pattern. It also would mesh with the 16-17-year cycle of major USD lows and our expectations regarding currency market fundamentals.
My name is Steve Saville. I have been a fulltime professional speculator since 1998 and the owner/editor of The Speculative Investor (TSI for short), a subscription-based web site focused on the financial markets, since 2000. More information about me can be obtained at the Editor’s Bio page. In an average week, TSI subscribers receive two reports: a Weekly Market Update on Sunday and an Interim Update on Thursday morning (NYT). The Weekly Update typically has 3500-5000 words and 15-20 charts, while the average Interim Update is about half that size. As well as containing information about the gold, currency, stock, bond and commodity markets, these reports regularly include discussions about macro-economics. The economics-related discussions are from an “Austrian” perspective, because the Austrian School is the only school of economics that is based on correct premises, is consistently logical and explains how the human world really works. If something unexpectedly dramatic happens in the markets between the regular TSI reports, I usually will email a brief update to subscribers. Additionally, email alerts are sent when immediate action is warranted with an existing or new trading position. TSI subscribers also get access to a list of stock selection ideas. The TSI stock selections have provided very good long-term returns, but due to the highly speculative nature of the stocks I tend to focus on at TSI the year-to-year returns have been ‘lumpy’. For example, since 2000 my own equity portfolio, which contains many of the stocks covered at TSI, has had six triple-digit years (years when the portfolio was up by at least 100%, without using any debt-based leverage and maintaining a cash reserve of at least 20%) and two years of 50%+ losses. The year-to-year ‘lumpiness’ of the performance that goes hand-in-hand with my focus on relatively risky (by traditional standards) equities will make the TSI stock selections unsuitable for some people, although the macro/top-down analyses included in the TSI commentaries still could be useful to conservative investors looking for guidance about financial-market trends. In addition to the stock selections that are included in the TSI Stocks List and updated via the weekly TSI commentaries, I regularly mention ETF and options trading ideas that my readers, if interested, can follow-up on.
|
Send this article to a friend:
 |
 |
 |
 Since 1970, which roughly was when the current monetary system involving no official link to gold was born, the USD/CHF exchange rate (the US$ relative to the Swiss franc) has experienced a repeating pattern of 8-10 years down followed by 6-8 years up. We rarely discuss this cycle at TSI, because it only becomes relevant when the window for a cyclical turning point is entered, which only happens every 6-10 years. We are discussing it today because a turning-point window has been entered.