
Send this article to a friend:
September
16
2020

|
Send this article to a friend: September |
|
Down-to-Earth Aspects of the US Economy in Near-Real Time
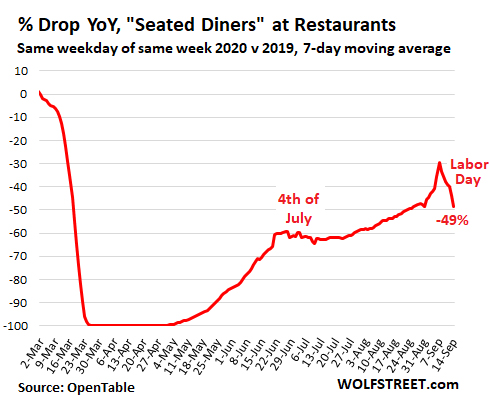
The US economy is completing the sixth month of the Pandemic. So how is the recovery going, as seen by the near-real-time indicators that have sprung up as a result of the Pandemic? The raw unadjusted data of these indicators compare daily or weekly data this year to how it was just before the Pandemic, or how it was at the same time last year. There is some roughness in this data. For example, this year, Labor Day fell on September 7; last year, it fell on September 2 (prior week). So there are some wild fluctuations as Labor Day data gets compared to non-Labor Day data. Independence Day was similar. But that’s raw data. Restaurants, “seated diners”: -49% Online reservation service OpenTable provides daily data on “seated diners” – how many people actually sit down in restaurants to eat and drink compared to the same weekday in the same week last year – including walk-ins and those who made reservations online or by calling. This data is based on thousands of restaurants in the US that share that information with OpenTable. I used a 7-day moving average to smoothen out the day-to-day fluctuation. The date-mismatch of Labor Day caused the spike in the chart below. Currently, after six months of Pandemic, “seated diners” are still down 49% through September 14, from where they’d been last year at this time:
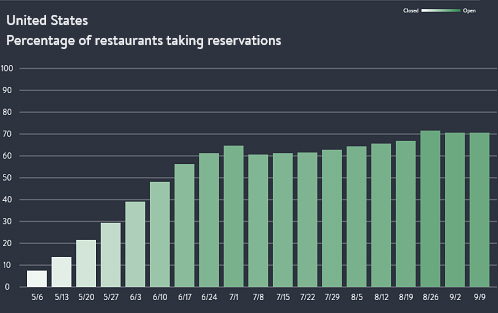
In the chart above, that plunge to -100% (meaning zero seated diners) occurred during the lockdown when sit-down restaurants were closed. Then the recovery took off in its uneven manner, including some backtracking after Independence Day. According to OpenTable data, about 70% of the restaurants that took reservations before the pandemic are now taking reservations again, up from zero percent in April, and there has not been any improvement over the past three weeks, and not a lot of improvement since early July (chart via OpenTable):
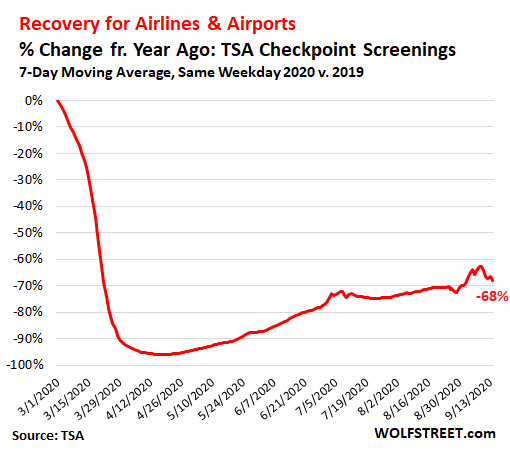
Airlines, Airports, & Related Businesses: -68%.The air passenger count entering the security zones of US airports is still down over 68% (-69.7% on September 14), according to TSA airport screenings. Airport operations, restaurants and shops at airports, airport rental cars, and the rest of the airport ecosystem are on a similar trajectory. Beyond the date-mismatch around Labor Day, demand has improved only slightly since early July:
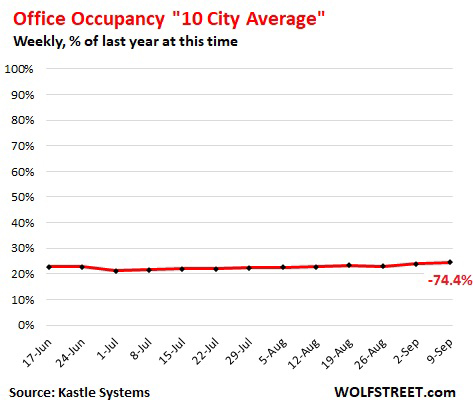
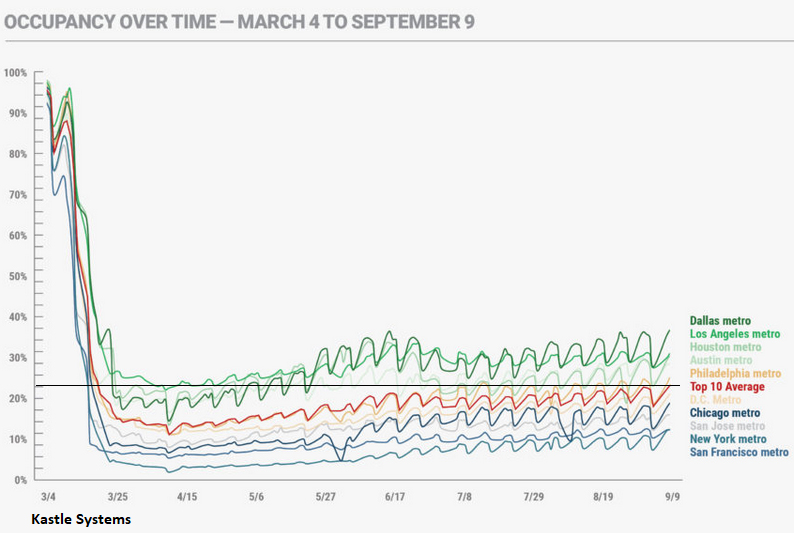
Going to the Office: -74.4%. This is a measure of the shift to work-from-home mixed with employment reductions of office workers, and sheds light on what all the businesses face that cater to office workers, such as cafes, restaurants, shops, barbershops, hair saloon, and the like. And it sheds light on what the office segment of commercial real estate is facing. The data from Kastle Systems, provider of access systems for 3,600 buildings and 41,000 businesses in 47 states, represents a large sample of how many people are entering offices each day. Its “10 City Average” of office occupancy is currently at 24.6% of the pre-Pandemic level in early March, and has not significantly improved in over the past few months, meaning it’s still down by 75.4% (the available average data only goes back to June):
The weekly “Back to Work Barometer” by Kastle shows each of the 10 metros separately: At the high end, the Dallas metro (38.3% of pre-Pandemic) and the Los Angeles metro (32.4% of pre-Pandemic); at the low end, the San Francisco metro (13.7% of pre-Pandemic) and the New York metro (13.8% of pre-Pandemic), meaning that office occupancy in those 10 metros is still down between 61.7% (Dallas) and 86.3% (San Francisco). I added the black horizontal line, reflecting the current value of the top-10-city average (click on chart to enlarge):
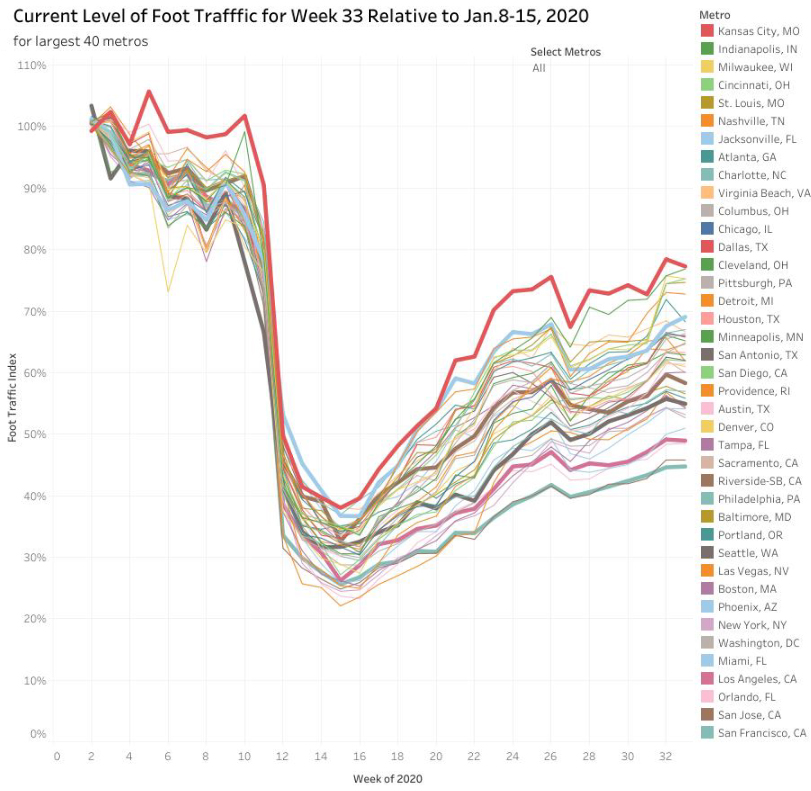
To get a feel for what San Francisco’s office situation looks like visually, here are the haunting photos I took during the morning rush hour of the spookily empty Financial District. Consumer and worker visits to “Places of Commerce.” How many people are going to stores, malls, restaurants, hotels, movie theaters, airports, hospitals, other places of commerce, and other points of interest, and to work locations? The AEI’s weekly Foot Traffic Index for 40 metro areas tracks this based on cellphone GPS data from Safegraph.com. Each line, representing one of the 40 metros, compares foot traffic in the current week to where visits were in the week ended January 15. A value of 100% would mean foot traffic is back to the January “old normal.” The top bold redlines are Kansas City, Jacksonville, Riverside-San Bernardino, Seattle, Los Angeles, San Francisco, in that order, with Kansas City being the red line at the top (77%) and San Francisco being the green line at the bottom (45%). This means visits to places of commerce in Kansas City are 77% of where they were in the week ended January 15; and in San Francisco, visits are 45% of where they were (click on the chart to enlarge it):
These near-real-time measures don’t track the entire economy, such as manufacturing, oil-and-gas drilling, financial services, insurance, and many other aspects. But the data show that certain physical aspects of the economy – where people are physically going to do business in some manner – are still very far from the “old normal.” Enjoy reading WOLF STREET and want to support it? Using ad blockers – I totally get why – but want to support the site? You can donate. I appreciate it immensely. Click on the beer and iced-tea mug to find out how:
Would you like to be notified via email when WOLF STREET publishes a new article? Sign up here.
|
Send this article to a friend:
 |
 |
 |


![[Most Recent Quotes from www.kitco.com]](http://www.kitconet.com/images/live/s_gold.gif)
![[Most Recent USD from www.kitco.com]](http://www.weblinks247.com/indexes/idx24_usd_en_2.gif)
![[Most Recent Quotes from www.kitco.com]](http://www.kitconet.com/images/live/s_silv.gif)