
Send this article to a friend:
September
10
2018

|
Send this article to a friend: September |
|
Why Most Investors Fail to Beat “The Market”
But Chris Mayer, Bill’s ace stock picker, doesn’t see what all the fuss is about. As today’s guest editor, he shows readers how to look past the headlines and aim at the bigger picture. You probably keep hearing about how this bull market is now the longest on record. To me, it’s an interesting tidbit, but it doesn’t really mean much. For one thing, we don’t own “the market” – which, in these contexts, usually means the S&P 500 Index. We own individual stocks. As I always like to remind people, the ups and downs of those stocks can be very different from those of “the market.” For example, here are the 10 best-performing stocks in the S&P 500 for the first half of the year:
And here are the 10 worst-performing stocks:
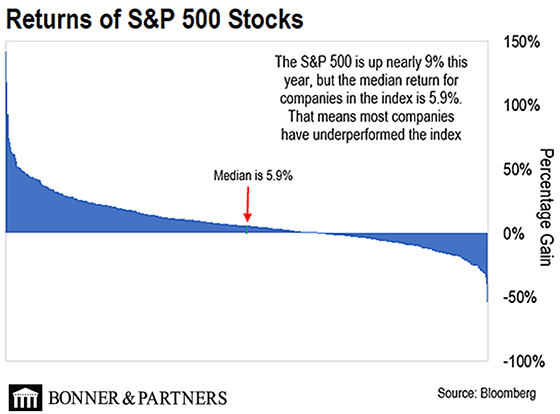
Look at the huge gaps between best and worst… Just because the S&P 500 keeps making record highs, doesn’t mean all stocks are rising. You can make a list just like this for any year. There is no such thing as an “average” stock. This reminds me of something Robert Anton Wilson – author of books such as Quantum Psychology and the Cosmic Trigger trilogy – wrote: “I have never seen a normal man or woman, or an ordinary dog… the normal, the average, the ordinary describe that which we never encounter outside mathematics, i.e., imagination, the human mindscape.” The idea of a stock market is a product of our imagination. It implies that all stocks are at least similar. But stocks are different from each other and perform differently. Another way to see this is to look at the median stock return. The median is the middle return. Here is how the stocks in the S&P 500 have performed overall year-to-date:
In any given year, a whole bunch of stocks in the S&P 500 underperform the index. For the first half of this year, 62% of the stocks in the S&P couldn’t keep up with the index. Most of the time, only a handful of really big winners drive returns. This is why the S&P 500 is so hard to beat. Why It’s Hard to Beat the Market A simple analogy by Oliver Renick (who wrote for Bloomberg) illustrates this point. Imagine a bag with five poker chips in it. Four of them are worth $10, and one is worth $100. The average value of the poker chips is $28. If you reach into the bag and pick two poker chips, you’ll find that you can only beat the average if you grab the $100 chip. And statistically, you’ll fail to grab that chip six out of 10 times. The bag of poker chips is akin to the stock market. And stock pickers are like the guys pulling two chips out of the bag. Now you see why it’s so hard to beat the average. In recent years, the dominant stocks are big “tech” names. FAANG is the acronym coined to refer to these leaders: Facebook, Apple, Amazon, Netflix, and Google. Year-to-date, these five giants have accounted for nearly 40% of the S&P 500’s return. Chad Brand, president of Peridot Capital Management, recently coined FAAAM – which includes Microsoft and drops Netflix (the third A stands for Alphabet, Google’s parent company). By doing this, you have five of the largest market caps in the S&P 500. Combined, these stocks are worth over $4 trillion and represent 16.5% of the index. Here is a snapshot, per Brand:
Numbers as of September 4, 2018 I’d draw your attention to the last two rows – both valuation metrics. EV stands for enterprise value. It is market cap plus debt less cash. It shows you what value the market puts on the entire company. TTM is trailing 12 months. And EBITDA is a broad earnings measure. EV/EBITDA is good for comparing companies to each other because it factors in debt, as opposed to the simple price-to-earnings ratio, which is net of debt and interest payments. Anyway, the numbers here are not cheap. As Brand writes:
This is a good question… What happens is that if revenue growth slows – which seems inevitable, as these companies get so big – those stock multiples will fall. And the stocks will get whacked. That’s why when people say, “Stocks are expensive,” my follow-up is always, “Which stocks?” Because I can show you stocks that seem inexpensive. And I can show you stocks that seem expensive. It’s all in the picking. This is another reason I get bored when people talk about “the stock market.” I invest in stocks, not the market. They’re not the same. Regards,
Chris Mayer P.S. I recently spoke with a billion-dollar hedge fund manager, whose name I can’t reveal. What we discussed led me to find what I believe is the biggest no-brainer opportunity of all. In the past, similar stocks have shown investors massive peak gains of 95,800%, 63,400%, and even 216,100%. To discover what I was clued into, click here.
| ||||||||||||||||||||||||||||||||||||||||||||||||||||||||||||||||||||||||||||||||||||||||||||||||||||||||||||||||||||||||
Send this article to a friend:
 |
 |
 |


![[Most Recent Quotes from www.kitco.com]](http://www.kitconet.com/charts/metals/gold/t24_au_en_usoz_2.gif)
![[Most Recent USD from www.kitco.com]](http://www.weblinks247.com/indexes/idx24_usd_en_2.gif)
![[Most Recent Quotes from www.kitco.com]](http://www.kitconet.com/charts/metals/silver/t24_ag_en_usoz_2.gif)