
Send this article to a friend:
August
08
2022

|
Send this article to a friend: August |
|
Signs of Capitulation Everywhere
Month of July 2022
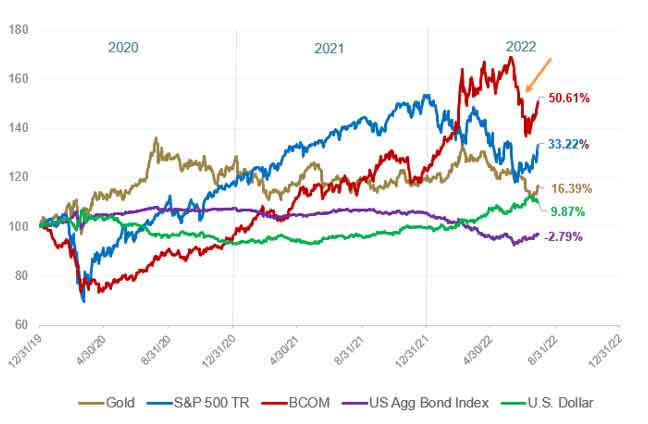
Source: Bloomberg and Sprott Asset Management LP. Data as of July 31, 2022. Dollar amounts are in U.S. dollars (USD). *Mo % Chg and YTD % Chg for this Index are calculated as the difference between the month end's yield and the previous period end's yield, instead of the percentage change. BPS stands for basis points. July Review As shown in Figure 1, July was a continuation of 2022's wild ride. The spot gold price fell $41.33 (or -2.29%) to close at $1,765.94 for the month. July was particularly volatile as gold fell sharply in the first week of the month as CTAs (Commodity Trading Advisors, i.e., quant funds, investment funds that selects securities using advanced quantitative analysis) heavily shorted gold along with the entire commodity complex (source: Bloomberg). The gold price continued to fall until the futures and options expiry7 date on Friday, July 15 (the third Friday of every month, i.e., July 15), a common occurrence this year. At its intraday low on July 15, gold touched $1,680.99 in a short-lived pre-market dip but quickly rallied to $1,765.94 at the close of the month. The gold selloff in early July was a collateral effect of a wild liquidation event across all commodity and resource equities that characterized the post-July 4 trading week, which was a very illiquid period. Figure 1. 2022's Wild Ride (2020-2022)
Source: Bloomberg and Sprott Asset Management. Data as of 7/31/2022. Gold is measured by GOLDS Comdty Spot Price; S&P 500 TR is measured by the SPX; BCOM is the Bloomberg Commodity Index; US Agg Bond Index is measured by the Bloomberg Barclays US Agg Total Return Value Unhedged USD (LBUSTRUU Index); and the U.S. Dollar is measured by DXY Curncy. Included for illustrative purposes only. Past performance is no guarantee of future results. By contrast, the broader equities markets (S&P 500 Index), which had fallen into bear market territory, staged their third best one-month return in the past 10 years. This rally was not driven by a Federal Reserve (Fed) pivot or an economic turnaround but was most likely the result of short-covering8 dynamics. The S&P 500 hit its recent low during the June 17 OpEx (the half-year Options Expiration tends to be very significant) as many hedges rolled off. Short covering, put options9 decaying and implied volatility10 declines all led to the further unwinding of hedges and created a "synthetic bid," or a defacto short squeeze. (A "short squeeze" describes a phenomenon where a sharp rise in an asset price — in this case, the S&P 500 Index — forces traders who previously sold short to close their positions.) This short squeeze effect was further amplified by the poor state of market depth (i.e., very little trading liquidity) which has continued to deteriorate. As volatility waned, systematic volatility-control funds re-engaged, buying back S&P 500 positions they had sold earlier in the year. Long-term U.S. Treasury bond yields appear to be putting in at least a near-term top. Growing recession fears and a large bond short position finally gave way in late July. Weak U.S. and European Union (EU) PMI (purchasing managers' index)11 numbers catalyzed a sharp drop in yields, and the short bond squeeze came to life as panic trades (or a VaR event)12 took hold. By the end of the month, net short positions in bonds were reduced by about half, as measured by CFTC (Commodity Futures Trading Commission) activity. With GDP (gross domestic product) results for Q2 at -0.9%, following Q1 GDP of -1.5%, we are in a "technical recession". However, since the surge in the Fed's interest rate hikes (150 basis points in June/July; 225 basis points year-to-date), we believe the economic repercussions have yet to be realized. With headline inflation running at +9% (based on the CPI, i.e., the consumer price index) and supply-driven sticky inflation forces still unresolved, stagflation pressures continue to mount. Although the magnitude of Fed rate increases may decelerate (i.e., 75 basis points hikes slowing to 50 basis points), they are still expected to continue (Figure 2). Figure 2. Fed Rate Moves 2020 - 2022: From Fighting the COVID-19 Recession to Fighting Inflation
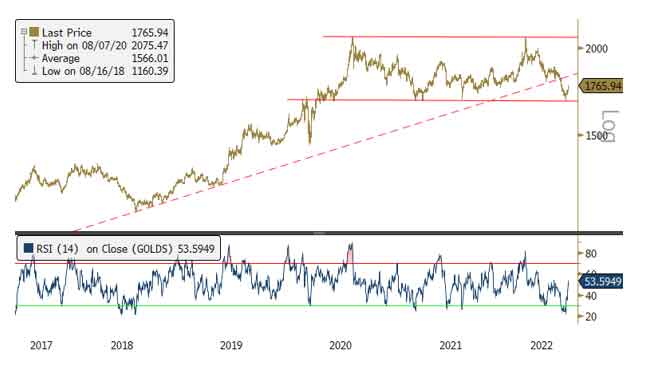
Source: Federal Reserve Monetary Policy. *Federal Open Market Committee (FOMC). The Sudden Liquidation of Commodities Although equities and bonds had an active and ultimately positive July, the action in commodities was the most dramatic and significantly impacted gold. Well before the first week of July's commodities selloff, the Fed tightened financial conditions at the quickest pace since 2008 and 2020, putting the wealth effect into reverse. With tighter financial conditions, fiscal and monetary stimulus impulses have long faded, and quantitative tightening (QT) has further reduced liquidity. This liquidity removal caused most asset classes to lose value, resulting in the "everything" bear market. Instead of asset class rotation (risk asset capital moving to safe havens), we have seen across-the-board exposure reductions, or degrossings, for all types of investments. Related to liquidity draining, volatility of all asset classes (including currencies, bonds, equities and commodities) has soared and has caused VaR-related selling of all asset types. Since early June, following the tough May CPI report release, there has been a growing concern about Fed hawkishness and its negative effect on the growth outlook. This theme played out globally in July as most central banks were hiking aggressively to head off the risk of high inflation becoming further entrenched. As the global growth outlook weakened further, the commodities complex, which had been the star performing asset class year-to-date, gave way spectacularly. From the early June highs, the Bloomberg Commodity Index (BCOM)13 fell 20% in four weeks, from 136.61 to 110.75 (see Figure 1 far right, orange arrow), the quickest plunge since the GFC (global financial crisis) and the March 2020 COVID selloff. There was no comparable economic or market calamity to explain this sudden significant liquidation. If we were to convert it into gold terms, it would be equivalent to the gold price falling from $2,070 to $1,660 in four weeks. The good news is that the BCOM recouped some losses in the final three weeks of July to end the month relatively flat (117.13 to 121.83; Source: Bloomberg). Gold mining equities, as expected, fared worse, with maximum drawdowns in the -35% to -40% range for the energy, industrial metals miners and precious metals miners sectors. As we have mentioned before, the mechanical nature of trading markets and the low levels of market depth (thin trading liquidity) are likely to amplify and distort price actions. Still, the price action was remarkable and unrelenting and the "selling into a vacuum" phenomenon was visibly demonstrated. Over time, commodities have become highly financialized and collateralized, with CTAs have become their dominant trading force. For investors, the challenge of separating market noise from fundamentals continues. Gold Bullion, Silver and Gold Equities: All at Major Support, Signs of Capitulation Everywhere Gold bullion broke the uptrend from the 2018 lows we have discussed for the past year. Technically, gold fell to the primary support of $1,675 per ounce and bounced off this level, hitting an oversold reading on RSI (Relative Strength Index)14 that matches the 2018 lows (Figure 3). The speed of the fall from the early March 2022 high of $2,070 was the quickest selloff since the 2013 Taper Tantrum, the post-2016 U.S. presidential election Trump victory and the 2018 Fed attempt at "policy normalization". Figure 3. Gold Bullion: Broken Uptrend, Oversold and New Trading Range (2017-2022)
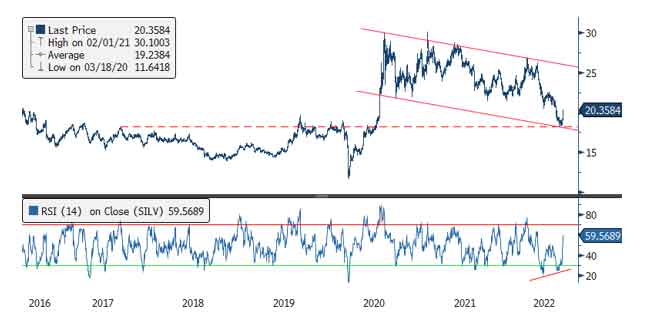
Source: Bloomberg and Sprott Asset Management. Data as of 7/31/2022. Included for illustrative purposes only. Past performance is no guarantee of future results. Silver fell to the major support level of $18.50 on the most significant drop in ETF silver ounces held since 2011 and a notable increase in CFTC shorts in silver. However, silver had a sharp recovery to recoup all of July's loss, likely on short covering. Figure 4 shows how silver completed five waves down on its last selling leg and reached the down channel projection to key support, putting in a positive divergence on RSI. Positioning data and chart patterns are all consistent with selling capitulation into exhaustion. If silver's $18.50 level holds with signs that ETF silver ounces are growing, the elements needed for a tradeable low are likely in place. Figure 4. Silver Bullion: Successful Test of Key Support, Capitulation Evident (2016-2022)
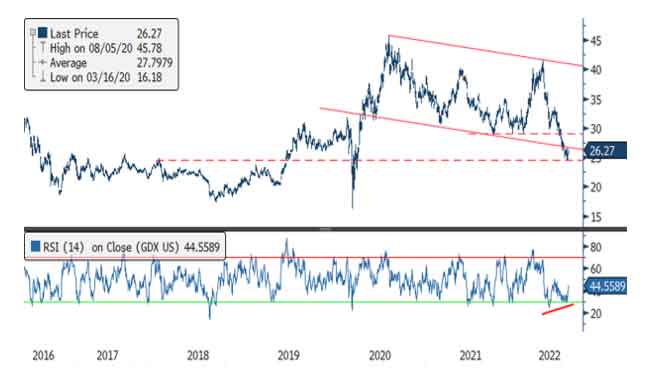
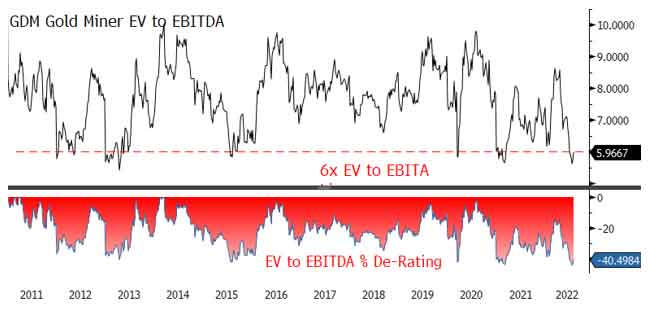
Source: Bloomberg and Sprott Asset Management. Data as of 7/31/2022. Included for illustrative purposes only. Past performance is no guarantee of future results. Gold mining equities (GDX ETF)4 fell below the $29-$30 support level to test the $25 level, a significant support range (Figure 5a). The RSI declined to the same levels as in 2018 and 2020, two extreme levels of prior capitulation. However, the current setup has put in a positive divergence reading, indicating a potential sharp mean reversion move higher. In Figure 5b, we show how the gold miners have fallen back to their 10-year low range on a valuation basis. Historical analysis indicates that when the gold miners' EV/EBITDA15 ratio falls below 6x, the potential return within a six-month window has been about 21% on average over the past 10 years. Also noteworthy is the current de-rating in the EV/EBITDA ratio is one of the most significant in more than 10 years. Figure 5a. Gold Mining Equities at Extreme Technical Readings (2016-2022)
Source: Bloomberg and Sprott Asset Management. Data as of 7/31/2022. Included for illustrative purposes only. Past performance is no guarantee of future results. Figure 5b. Gold Equities: GDM16 Gold Miners EV/EBITDA Ratio at Extreme Valuation Lows (2011-2022)
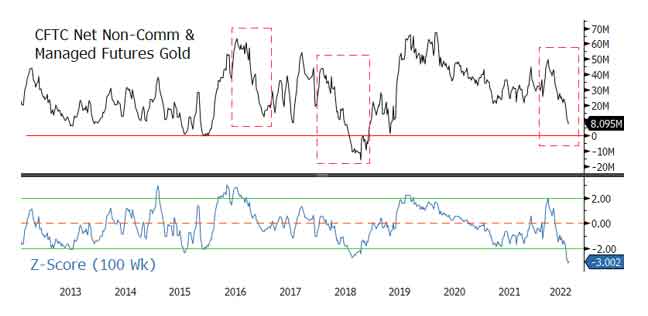
Source: Bloomberg and Sprott Asset Management. Data as of 7/31/2022. Included for illustrative purposes only. Past performance is no guarantee of future results. Why Did Gold Fall So Hard and So Fast? Since gold's closing high of $2,051 in March 2022, it has fallen to a closing low of $1,697 in late July, a drop of $354/oz or 17.26% in four months. The direct cause was expectations of very hawkish Fed rate hikes, and the progression of expected rate hikes was remarkable. Earlier in the year, a 50 basis point rate hike was a hawkish outlier, but by mid-July, the market was discounting 100 basis point moves. Much more aggressive Fed rate hike expectations relative to other global central banks were a significant cause of U.S. dollar (USD) strength and rising real yields, adversely affecting gold. We believe the recent parabolic USD surge is due to 1) the spread of U.S. 2-year Treasury yields versus G7 2-year government bond yields rising at its fastest pace in a decade; 2) a weak Yen due to the Bank of Japan's yield curve control creating a cap on yields; 3) a weak Euro due to a long list of European Union issues (i.e., the energy crisis, stagflation, fragmentation, periphery bonds, a European Central Bank that is much further behind the curve); and 4) the China Yuan devaluation and the associated potential Asian currency war. As aggressive rate hike expectations were being priced in by markets, nominal yields quickly rose in anticipation of Fed hikes. However, breakeven yields were rolling over in anticipation of slower growth due to the higher rate effect on the economy. Real yields (real yield = nominal yield minus breakeven yield) rose sharply in this period, adding to USD pressure on gold. Figure 6 below highlights the influence of trading in the CFTC futures markets, typically by CTAs and other systematic/quant type funds, on the gold price. In the past 10 years, CFTC positioning has been range bound, typically about zero to 60 million ounces (currently at the 10th percentile). Furthermore, the trading pattern is mean reverting, where large movements, either up or down, are reversed in the following trade leg. The lower panel of Figure 6 shows a 100-week Z-score17 reading at -3 standard deviation,18 the lowest reading in 10 years. Historically, the odds favor a reversal at the 10th percentile and a -3 standard deviation Z-score, and the threshold to mean revert will likely be relatively minor. Historically, when CFTC positioning falls below the 10thpercentile within the next six months, the average return potential has averaged ~12%. Figure 6. CFTC Net Non-Comm Gold & Managed Futures Gold Bullion Holdings in Millions of Ounces (2013-2022)
Source: Bloomberg and Sprott Asset Management. Data as of 7/31/2022. Included for illustrative purposes only. Past performance is no guarantee of future results. The 1970s Inflationary Bear Market Playbook The market appears to be following the 1970s inflationary bear market playbook, as indicated by the following: 1) demand far exceeds supply, inflation shock arrives; 2) the Fed signals it will do whatever it takes to control inflation and creates the rate shock; 3) the market prices in a recession and bear market; and 4) once inflation is deemed defeated, and the Fed pivots, markets quickly turn to the future recovery even if conditions are still fragile. A year ago, CPI was running at 5%, and transitory inflation was quickly morphing into an inflation shock. By early 2022, the rate shock took hold as expectations of Fed rate hikes soared and pressured all markets. By July, with commodities rolling over, the yield curve more inverted, yields looking toppy, and a technical recession confirmed, we believe that the recession shock will likely be the next factor that markets need to discount. If the markets follow the past, they are likely to be pricing recession effects such as the magnitude and depth, earnings impact and the risk to credit markets. The markets will also likely start to discount the eventual Fed pivot, even if the Fed is still focused on inflation. Everything is happening faster this cycle, from the recovery and bull market to a recession and bear market in quick succession, and whipsawing investors. All About the Fed Pivot In an ironic twist, Fed policymakers tried to prevent a disastrous deflationary spiral in 2020 and ended up with a disastrous inflationary spiral a few years later. The Fed has acknowledged that its credibility is an issue and that there is a threat to high inflation becoming further embedded. Even if headline inflation falls quickly, the Fed may stay with a longer-than-expected hawkish, rate-hiking posture to ensure inflation is wholly defeated. Timing is critical for the Fed. After making a significant policy mistake, pivoting too early and allowing inflation to regain its footing would only worsen matters. Without a substantial recession or a significant credit event, the Fed may not execute an outright dovish pivot; a greater threat than the risk of unanchored long-term inflation expectations would be needed (a very high bar). Markets remain trapped between a hawkish Fed and a weakening global growth outlook. A soft-ish landing for the U.S. economy is appearing more remote, the EU list of economic nightmare scenarios continues to climb and China's economy is stuck in low growth. High inflation and the current political landscape will likely limit the degree of monetary and policy support. Further Fed rate hikes risk deepening a recession and causing a credit event. High credit spreads and the parabolic rise in the USD are signaling this potential. Commodity prices and bond yields rolling over is the market pricing in a recession. Without a pivot, a more profound recession shock is on the table. The strong July broad equities rally has given risk assets a better tone. But it is unlikely that the consequences of the highest inflation in 40 years, a growing synchronized global recession and the excess of the dozen years post-GFC have been unwound with a pedestrian bear market barely lasting only six months. If the large CFTC selling in gold (Figure 6) were related to the rate shock, we would expect CFTC gold holdings to mean-revert higher since the bulk of the rate shock has been discounted. The recession shock and its associated risks have yet to be fully priced, and we would expect buying in gold to resume along with a short covering.
|
Send this article to a friend:
 |
 |
 |

![[Most Recent Quotes from www.kitco.com]](http://www.kitconet.com/images/live/s_gold.gif)
![[Most Recent USD from www.kitco.com]](http://www.weblinks247.com/indexes/idx24_usd_en_2.gif)
![[Most Recent Quotes from www.kitco.com]](http://www.kitconet.com/images/live/s_silv.gif)