
Send this article to a friend:
August
28
2018

|
Send this article to a friend: August |
|
Gold at the Crossroads
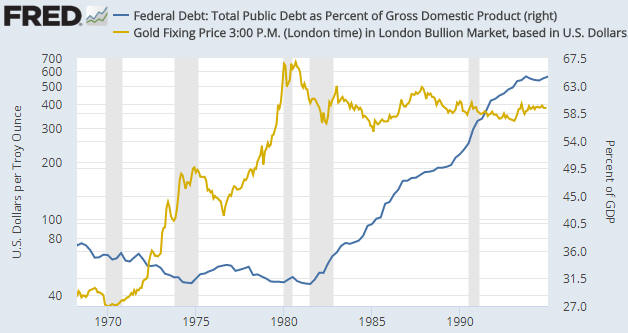
The article was published in early-May and states that the U.S. is in a mid-to-late stage recovery. While that statement was probably correct at the time, evidence has since emerged that the economy has entered the “Late-Expansion” stage. Note that the “Late-Expansion” stage could extend well into 2019 or perhaps even into 2020 and that the best leading indicators of recession should issue timely warnings when this stage is about to end. By the way, the extension of the Late-Expansion stage is why the industrial metals markets probably will commence new intermediate-term rallies later this year. My only substantial disagreement with the above-linked article is associated with the relationship between gold and fiscal policy. Parts of the article are based on the premise that expansionary fiscal policy and its ‘ballooning’ effect on federal debt are bullish for gold. This premise is false; expansionary fiscal policy is not, in and of itself, either bullish or bearish for gold. The effects that fiscal policy and the associated change in government debt have on the gold price will be determined by their effects on economic confidence. Of particular relevance, there’s no good reason to assume that an increase in government debt will bring about a decline in economic confidence, which is what it would have to do to be bullish for gold. In fact, if an increase in government indebtedness is largely the result of reduced taxes then it could lead to increased economic confidence for a considerable time and thus put DOWNWARD pressure on the gold price. That there should not be a consistent positive correlation between the gold price and the extent of US government indebtedness is borne out by the empirical evidence. In particular, the following chart shows that there was a NEGATIVE correlation between the US$ gold price and the US government-debt/GDP ratio between 1970 and 1995, with debt/GDP drifting lower during the long-term gold bull market of the 1970s and then trending upward during the first 15 years of gold’s long-term bear market.
The wrong assertion that an increase in the government’s debt burden is necessarily bullish for gold appears to rely on what happened during 1995-2011, in that during this 17-year period there was a positive correlation between the gold price and the US government-debt/GDP ratio. You must take a wider-angle view to realise that this 17-year period is an example of correlation not implying causation. The fact is that over the past 50 years the overarching correlation between the gold price and the debt/GDP ratio has been negative for more time than it has been positive. The steadfast belief that rising US government debt is bullish for the US$ gold price is similar to the steadfast belief that geopolitical conflict is bullish for the gold price. They are both superstitions. The gold price has never made sustainable gains in reaction to international military conflict or the threat of the same, and the gold price is just as likely to fall as it is to rise in parallel with increasing government indebtedness. The lagged response of the economy to the central bank’s monetary machinations is the key to long-term trends in the gold price. Therefore, it isn’t correct to say that gold is at the crossroads of fiscal and monetary policies (the theme of the above-linked article). It is correct, however, to say that gold is at the crossroads of bubble activities and the reduction of monetary fuel to support such activities. The current US economic boom is like the cartoon character that has run over the edge of a cliff, but hasn’t looked down yet. The character can continue running without any support as long as it doesn’t look down. At this stage, investors in stocks, bonds and other assets that have been propelled to sky-high valuations by monetary inflation are acting as if the temporary props put in place by the central bank still exist, so they don’t yet perceive the need for the support that gold can offer. Unfortunately, unlike in the cartoons when the time from running over the cliff to the point of recognition is always a few seconds or less, there’s no way to know in advance how long an artificial economic boom will persist after the monetary support is removed.
|
Send this article to a friend:
 |
 |
 |


![[Most Recent Quotes from www.kitco.com]](http://www.kitconet.com/charts/metals/gold/t24_au_en_usoz_2.gif)
![[Most Recent USD from www.kitco.com]](http://www.weblinks247.com/indexes/idx24_usd_en_2.gif)
![[Most Recent Quotes from www.kitco.com]](http://www.kitconet.com/charts/metals/silver/t24_ag_en_usoz_2.gif)