
Send this article to a friend:
July
30
2022

|
Send this article to a friend: July |
|
Gold – Summer Rally Has Started
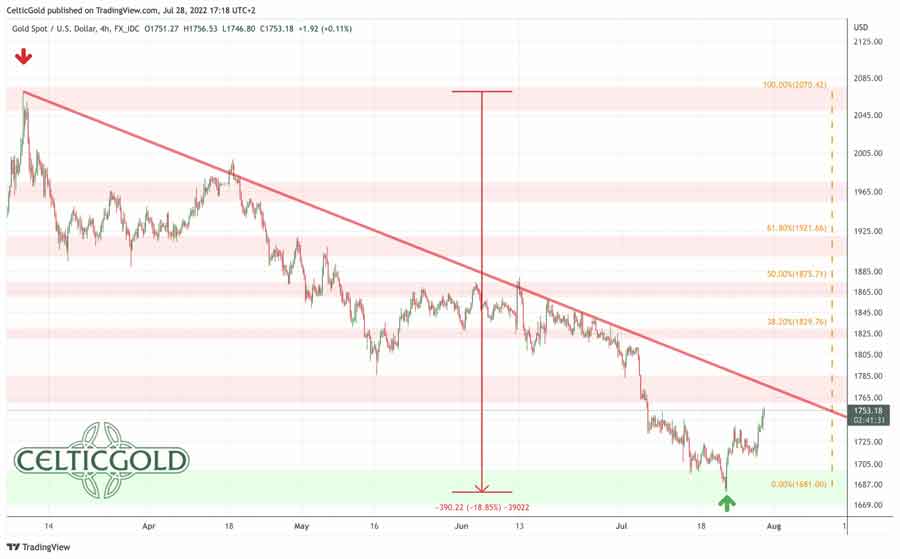
Review Gold prices reached an important high on March 8th, 2022, at around 2,070 USD and have since then slid into a brutal sell-off over the course of the last three and a half months. The final low of this wave down has been seen on Thursday, 21st of July, at 1,681 USD. Thus, gold has lost almost 400 USD or 18.8% in a rather short period of time.
Gold in USD, 4-hour chart as of July 28th, 2022. Source:Tradingview Besides the clearly overbought situation and the euphoric sentiment in March combined with the fact that precious metals are already within a correction since August 2020, the toxic mix of interest rate hikes & quantitative tightening of U.S. monetary policy, as well as high inflation data and collapsing stock & crypto markets, and thus a rampant recession, were primarily responsible for this selling pressure and the nasty downward spiral, which unfolded in the gold market. More and more investors plagued by the stock and crypto crash were thus forced to sell their physical precious metal holdings in order to access much needed liquidity. The “summer doldrums” we had hoped for have therefore not materialized this year. Rather did gold opt for our alternative scenario, which was a further price slide. After all, however, gold was able to recover quite impulsively over the last week and touched 1,750 USD this morning. Hence, yesterday’s FOMC meeting seems to have amplified a wave of short covering in the gold market. This could very likely develop into the typical summer rally over the coming one to three months, at least. Technical Analysis: Gold in US-Dollar Weekly Chart – At the upper edge of the 4-year uptrend channel
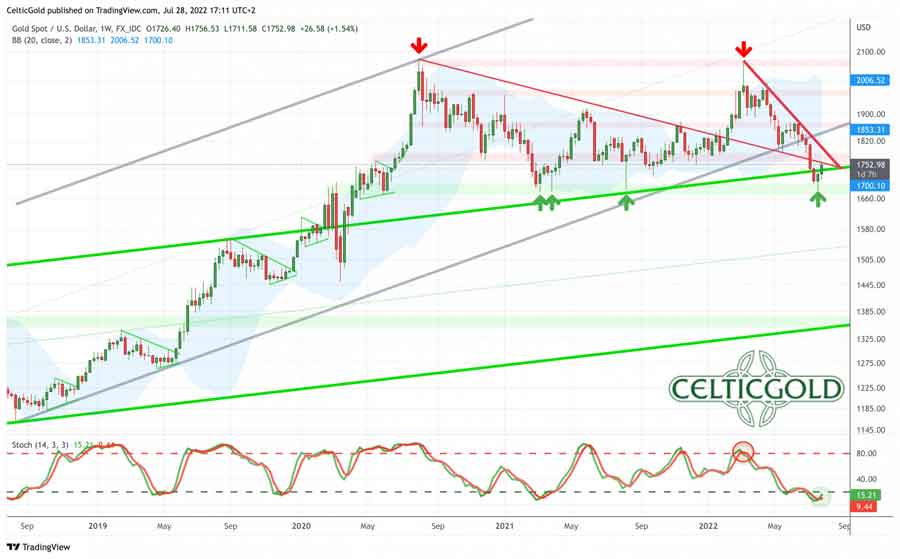
Gold in US-Dollars, weekly chart as of July 28th, 2022. Source:Tradingview On the weekly chart, gold corrected mercilessly over the last three and a half months. Finally, prices even dropped slightly below the upper edge of the flat uptrend channel established since August 2018 (in green). Only here, at the triple bottom (1,678 USD) from last year, gold bulls managed to stabilize the price action. And judging from a candlestick perspective, those last two green candles signaling a reversal. On top, the strongly oversold stochastic oscillator looks pretty promising. The oscillator has a lot of room for a strong rally lasting several weeks to several months. However, there is no clear “buying signal” yet from the weekly oscillator. Overall, the weekly chart is still in a downtrend. A clear trend reversal is not yet present. But a stabilization is definitely succeeding. If this is indeed a sustainable bottom, a bounce or even a strong recovery should make up quite some ground in the coming two to three months. Daily Chart – Stochastic buy signal
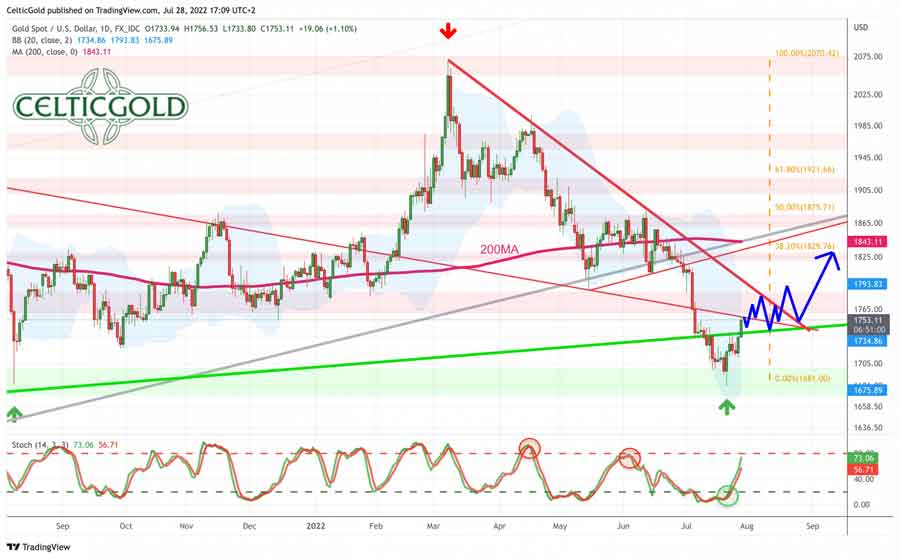
Gold in US-Dollars, daily chart as of July 28th, 2022. Source:Tradingview On the daily chart, the trend reversal is clearly visible. Since the low at 1,681 USD, gold is up more than 70 USD. This confirms our assumption that the bottom is in, and that gold has started some form of a recovery, at least. Now, the falling 200-day moving average (1,842 USD) will act as magnet and likely attract prices towards approx. 1,830 USD. Exactly here would also wait the 38.2% retracement of the entire wave down since March, which typically represents the minimum target of a countertrend move. All in all, the daily chart has been bullish for a week now and still provides a buy signal. However, the way up is paved with strong resistances. Around 1,755 to 1,760 USD, an older downtrend line is waiting. Here also begins the well-known resistance zone between 1,750 and 1,785 USD. Even stronger resistance is likely to come from the downtrend line of the last three and a half months (currently around 1,800 USD and falling fast). Below 1,700 USD and especially below 1,680 USD, however, the sell-off continues. In that unlikely case, prices around 1,625 USD must be expected. Commitments of Traders for Gold – Summer rally has started
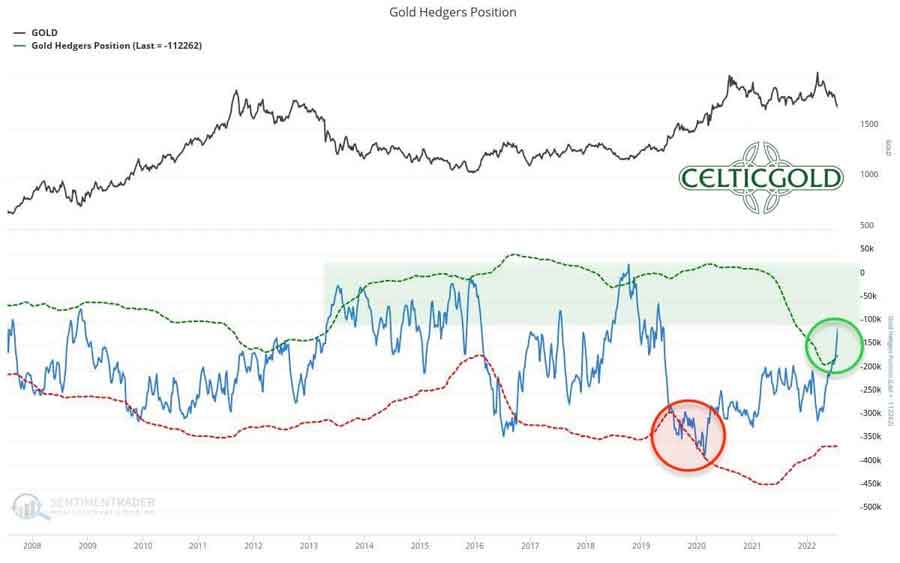
Commitments of Traders for Gold as of July 25th, 2022. Source: Sentimentrader Over the last four weeks, the cumulative net short position of the commercial market participants has dropped by another 66,307 contracts to “only” 112,262 gold contracts sold short. The commercial net short position is thus just slightly above the threshold of 100,000 short contracts, at which one can speak of a positive or bullish gold CoT report. In other words, professional market participants see less and less need to hedge against a falling gold price but are increasingly switching to the buy side due to the low gold prices. In summary, the CoT report can be classified as cautiously bullish. Sentiment for Gold – Summer rally has started
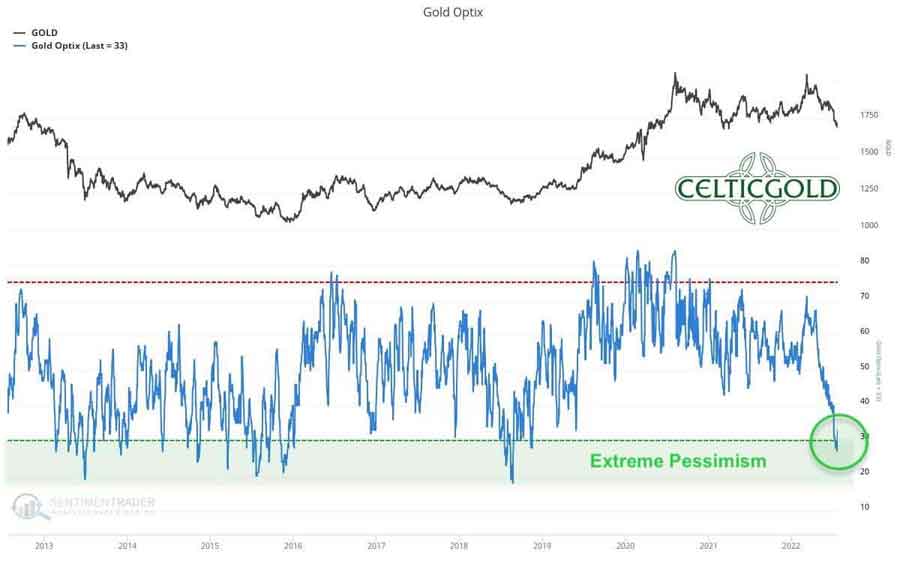
Sentiment Optix for Gold as of July 25th, 2022. Source: Sentimentrader The latest sentiment data for gold measure an extremely pessimistic sentiment for the first time since the fall of 2018! For almost four years, patient gold bugs had to wait for this promising contrarian setup!
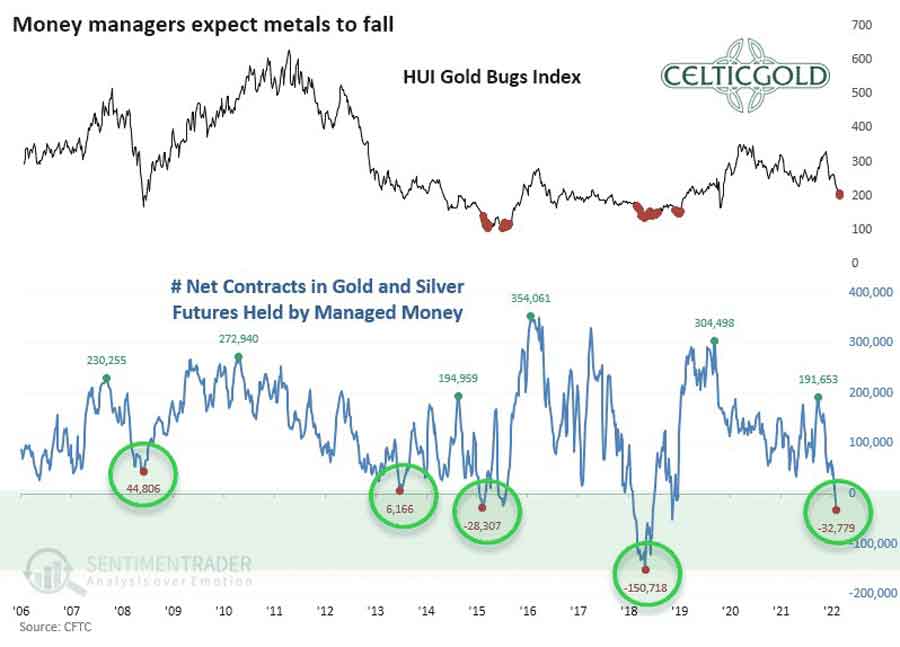
Gold & Silver future contracts held by managed money as of July 25th, 2022. Source: Sentimentrader Not surprisingly, asset managers currently hold the lowest cumulative number of gold and silver futures contracts in their client portfolios since August 2018, and this is the second-lowest positioning in a long-term comparison over the past 16 years. This low allocation is evidence of a very negative expectation for precious metals prices. Overall, the “sentiment traffic light” is now green and provides a contrarian buy signal! Seasonality for Gold – Summer rally has started
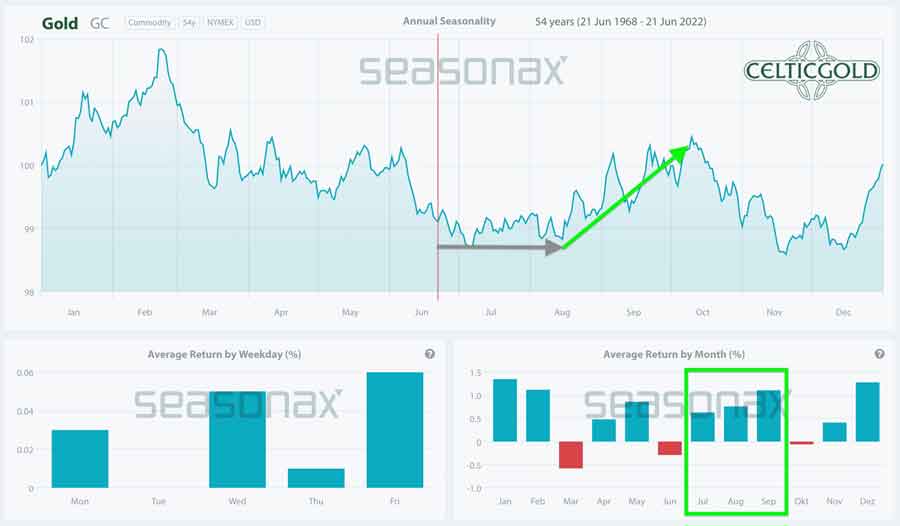
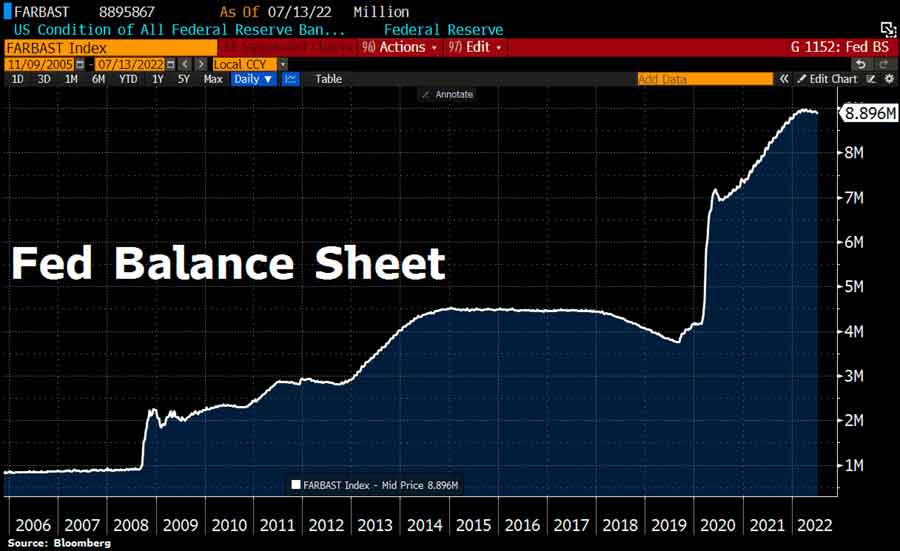
Seasonality for Gold over the last 53-years as of June 22nd, 2022. Source: Seasonax From a seasonal perspective, gold is about to begin its typical summer rally, which statistically has usually caused precious metal prices to rise sharply in August and September over the past 54 years. Seasonality for gold and silver is strongly bullish from now on until early October. Macro update: Panic, recession, and stagflationEver since the financial crisis of 2008, all central banks have been gradually providing the banking system and thus the entire financial system with huge amounts of additional liquidity through low interest rates and “quantitative easing”. This was intended to counteract deflation. Since the beginning of the Corona crisis, the U.S. Federal Reserve had once again significantly increased its holdings of government and mortgage bonds by 120 billion USD every month. However, after central bankers had long refused to acknowledge the resulting sharp rise in inflation, there have been no excuses since the official inflation rate topped 6-8% since the beginning of this year. Accordingly, the U.S. Federal Reserve had ended its bond purchases in March 2022 and announced its intention to reduce its balance sheet, which now weighs almost 9 trillion USD. Among other things, the monthly proceeds of up to 30 billion USD from maturing government bonds and up to 17.5 billion USD from maturing mortgage-backed securities were no longer to be reinvested from June 1st. Whether central bankers will succeed in a measured and slow exit from their ultra-soft monetary policy is anyone’s guess. So far, at any rate, the financial markets have reacted like a “junkie in withdrawal” to the change in central bank policy over the past seven months.
FED Balance Sheet Total as of July 13th , 2022, ©Holger Zschaepitz According to the official data released as of July 13th, the Fed has therefore already stopped shrinking its balance sheet again, as total assets increased by 4 billion USD to 8.896 billion USD as of July 13th. The Fed’s balance sheet now represents 36.5% of U.S. GDP, compared to 82% for the ECB and 135% for the BoJ.
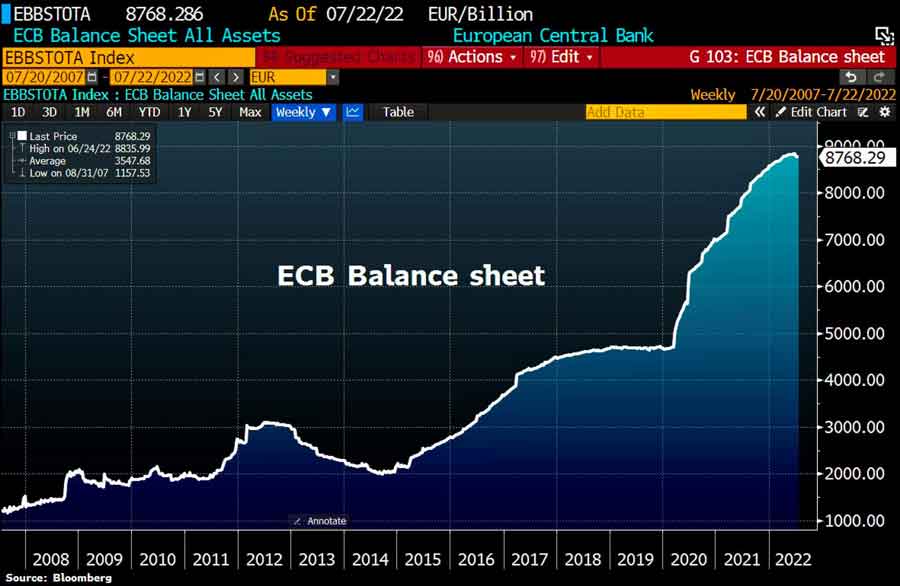
ECB Balance Sheet Total as of July 22nd , 2022, ©Holger Zschaepitz And the ECB’s balance sheet has also grown again recently after three weeks of contraction. Total assets rose by 2.6 billion EUR last week to 8,769.3 billion EUR. This means that the ECB balance sheet is still close to its all-time high and is now equivalent to 82% of eurozone GDP. In any case, the damage to the global economy has already been done and will likely worsen in the coming months, as the recession increasingly reaches the real economy after more than seven months of falling stock prices. Not only have valuations of almost all companies dropped significantly, but layoffs are on the rise and pay raises, bonuses and job offers are being canceled. In addition, start-ups are finding it very difficult, if at all, to obtain financing. Real estate markets have also long since peaked, with asking prices already falling and demand for mortgages lower than at any time since 2000. Home sales are currently declining most sharply for the cheapest properties, as potential buyers here are more price-conscious and generally more affected by changes in interest rates. But luxury home sales also fell nearly 18% between February and May. I.e. the Fed will hardly be able to raise interest rates any further into the fall without completely destroying the economy. But at the same time, inflation will remain elevated, so the stagflationary environment will continue to tighten. These are excellent conditions for a rising gold price. However, commodities and precious metals typically come under significant pressure in the early stages of an economic slowdown. This is exactly what has happened now. At the latest, when the U.S. Federal Reserve has to return to a loose stance as well as quantitative easing and interest rate cuts next year, gold prices will very likely break out to new all-time highs. Conclusion: Gold – Summer rally has startedWith a buy signal on the daily chart, a bombed-out sentiment and the very favorable seasonal component, there are currently three strong arguments on the table for an imminent summer rally in the gold market. The completely oversold weekly chart and the quite constructive CoT report also support this thesis. However, the financial markets have been in a contraction à la 2008 for months, which has dragged down all asset classes. Calling a bottom early on can be dangerous in this environment. Nevertheless, the chances of a summer recovery to around 1,830 USD are very good. Higher recovery targets are also conceivable. In the short term it is important that the bottom is confirmed, and that gold can continue its recovery towards approx. 1,770 to 1,775 USD, where a breather for one to three weeks can be expected. Analysis initially published on July 27th, 2022, by www.celticgold.de. Translated into English and partially updated on July 28th, 2022. Feel free to join us inour free Telegram channelfor daily real time data and a great community. If you like to get regular updates on our gold model, precious metals and cryptocurrencies you can also subscribe to ourfree newsletter.
|
Send this article to a friend:
 |
 |
 |

![[Most Recent Quotes from www.kitco.com]](http://www.kitconet.com/images/live/s_gold.gif)
![[Most Recent USD from www.kitco.com]](http://www.weblinks247.com/indexes/idx24_usd_en_2.gif)
![[Most Recent Quotes from www.kitco.com]](http://www.kitconet.com/images/live/s_silv.gif)