When will rising interest rates become a major problem for the stock market?
Steven Saville
 We asked and answered the above trick question in a blog post on 22nd March. It’s a trick question because although rising interest rates put downward pressure on some stock market sectors during some periods, they are never the primary cause of major, broad-based stock market declines. After all, the secular equity bull market that began in the early-to-mid 1940s and ended in the mid-to-late 1960s unfolded in parallel with a rising interest-rate trend, and the preceding secular equity bear market unfolded in parallel with a declining interest-rate trend. We asked and answered the above trick question in a blog post on 22nd March. It’s a trick question because although rising interest rates put downward pressure on some stock market sectors during some periods, they are never the primary cause of major, broad-based stock market declines. After all, the secular equity bull market that began in the early-to-mid 1940s and ended in the mid-to-late 1960s unfolded in parallel with a rising interest-rate trend, and the preceding secular equity bear market unfolded in parallel with a declining interest-rate trend.
As explained in the above-linked post from March-2021, when assessing the prospects of the stock market we should be more concerned about monetary conditions than interest rates. The reason, in a nutshell, is that it isn’t always the case that rising interest rates indicate tightening monetary conditions or that falling interest rates indicate loosening monetary conditions. For example, there was a substantial tightening of monetary conditions in parallel with falling interest rates during 2007-2008.
When attempting to determine the extent to which monetary conditions are tight or loose, one of the most important indicators is the growth rate of the money supply itself.
Rapidly inflating the money supply leads to a period of unsustainable economic vigour called a boom, while a subsequent slowing of the monetary inflation rate leads to a transition from boom to bust. Furthermore, once a boom has been set in motion a subsequent unravelling that eliminates all or most of the superficial progress becomes inevitable. The unravelling can be delayed by maintaining a fast pace of money-supply growth, but doing so will have the effect of making the eventual bust more severe.
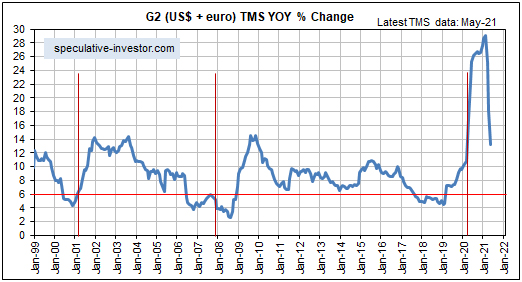
Over the past 25 years, booms have begun to unravel within 12 months of the year-over-year growth rate of G2 (US plus eurozone) True Money Supply (TMS) dropping below 6%. In the typical sequence there is a decline in the G2 monetary inflation rate to below 6%, followed within 12 months by the start of an economic bust (the unravelling of the monetary-inflation-fuelled boom), followed within 12 months by an official recession. Usually, the broad stock market begins to struggle from the time the boom starts to unravel, that is, from the time the G2 monetary inflation rate drops below 6%.
In the above-linked post from March-2021, we concluded:
“…it’s likely that the unravelling of the current boom will begin with the monetary inflation rate at a higher level than in the past. However, with the G2 TMS growth rate well into all-time high territory and still trending upward it is too soon (to put it mildly) to start preparing for an equity bear market.”
It is still too soon to start preparing for an equity bear market (as opposed to a significant correction, which may well be on the cards), but the following chart of the G2 TMS growth rate shows that there has been a dramatic change over the past few months. Based on what has happened and what probably will happen on the monetary front, the conditions could be ripe for the next boom-to-bust transition to begin during the first half of next year.

I have been a fulltime professional speculator since 1998 and the owner of a subscription-based web site about the financial markets since 2000. The web site is called “The Speculative Investor”, or “TSI” for short.
In an average week, TSI subscribers receive two reports: a Weekly Market Update on Sunday and an Interim Update on Thursday morning (NYT). The Weekly Update typically has 3000-4500 words and 10-15 charts, while the average Interim Update is about half that size. As well as containing information about the gold, currency, stock, bond and commodity markets, these reports regularly include discussions about macro-economics. The economics-related discussions are from an “Austrian” perspective, because I’ve found that the Austrian School is the only school of economics that is consistently logical and explains how the world really works.
TSI subscribers also get access to a list of stock selections. The TSI stock selections have provided very good long-term returns; however, due to the highly speculative nature of the stocks I tend to focus on, my year-to-year returns have been ‘lumpy’, to put it mildly. For example, since 2000 my own equity portfolio, which comprises many of the stocks covered at TSI, has had six triple-digit years (years when the portfolio was up by at least 100%, without using any debt-based leverage and maintaining a cash reserve of at least 20%) and two years of 50%+ losses. The year-to-year ‘lumpiness’ of the performance that goes hand-in-hand with my focus on relatively risky (by traditional standards) equities will make the TSI stock selections unsuitable for many people.
The price of a TSI subscription is US$240/year or US$25/month.
The TSI Blog was created in 2014, mostly for fun, but also to promote the TSI subscription service and to be a venue for me to make public comments that for one reason or another aren’t suited to the subscription service.
Steven Saville
tsi-blog.com
| 


![[Most Recent Quotes from www.kitco.com]](http://www.kitconet.com/images/live/s_gold.gif)
![[Most Recent USD from www.kitco.com]](http://www.weblinks247.com/indexes/idx24_usd_en_2.gif)
![[Most Recent Quotes from www.kitco.com]](http://www.kitconet.com/images/live/s_silv.gif)