Silver – Depressing and Exciting!
Gary Christenson
Short-term:
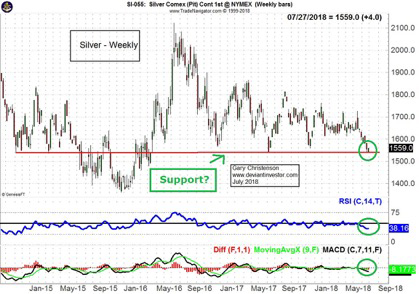
Silver looks oversold and ready to rally. Examine the weekly RSI (a timing indicator) and the MACD (a moving average indicator). These indicators suggest silver prices are low and could rally.
Medium Term:
Silver closed July 24 at $15.42, which for silver bugs is depressing or exciting: Why?
a) Depressing: Silver prices reached that $15.42 level in November 2007, over ten years ago. From that perspective silver has made no upward progress in ten plus years.
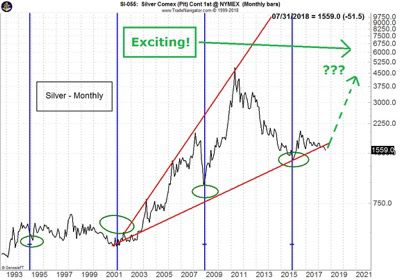
b) Exciting: In the long term politicians and bankers will create unpayable debts, debauch the currency, lie about their actions and boost most consumer prices, including silver. Silver prices have languished for years—they’re due for a rally, perhaps a huge rally.
Consistent with the “exciting” analysis is this commentary by Ted Butler, the COT and JPMorgan expert. Also from Bill Holter – link here. Another from Ted Butler is here.
Long-Term Silver Prices:
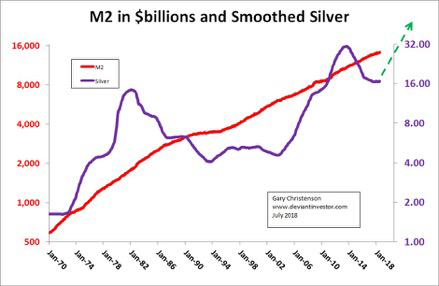
M2 (per the St. Louis Fed) is a measure of currency in circulation. It rises exponentially, like other measures of currency in circulation, total debt, pension liabilities, cost-of-living, stock market indices, and commodity prices. Silver prices follow. Examine the chart of smoothed silver prices (36 month simple moving average of monthly closes) and M2.
Summary:
Bankers and politicians create dollars from “thin air” via fractional reserve banking and QE. Total currency in circulation and debt increase more rapidly than the economy grows. This increases prices. The NASDAQ and most stock indices rise and fall too far and too fast, reach an unsustainable top and crash. The same is true for silver and gold, but they “listen to a different drummer.”
The NASDAQ 100 Index and its manic-depressive behavior (approximate prices).
Date Index Comment
January 1996 530 Ready to rally
March 2000 4,800 Ready to crash
October 2002 800 After the crash
November 2008 1,020 Ready to rally
July 2018 7,400 Ready to (crash?)
Silver prices and its manic-depressive behavior.
August 1976 $4.00 Ready to rally
January 1980 $50.00 Ready to crash
January 1982 $5.00 After the crash
November 2001 $4.00 Ready to rally
April 2011 $48.00 Ready to crash
December 2015 $13.60 Ready to rally
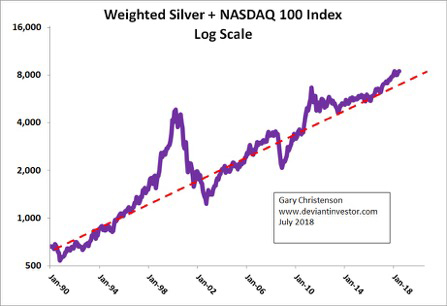
Prices for the NASDAQ 100 and silver offset each other. One rises while one falls. The sum however, rises exponentially, thanks to on-going dollar devaluation process favored by bankers and politicians. Examine the log-scale chart of their weighted sum (88 times silver + NASDAQ 100).
Are silver prices low or high compared to the NASDAQ? Examine the ratio of silver to the NASDAQ 100.
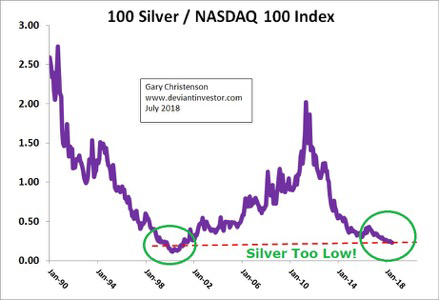
Summary: Silver prices are low compared to the NASDAQ 100 in 2018. They have been high in the past and will be again—someday.
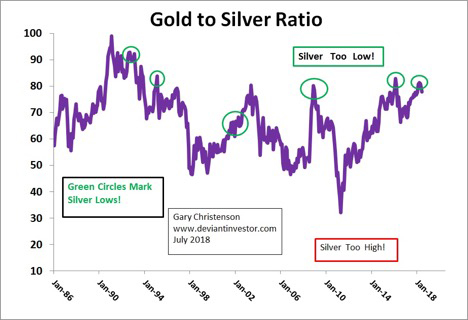
Gold to Silver Ratio over 30+ Years:
CONCLUSIONS FOR SILVER:
- In the short-term, silver prices are low, over-sold and due for a rally. Exciting!
- Many investors who bought in the past eight years are “underwater” and irritated. A few kick themselves because they bought silver rather than Netflix or Amazon. Stuff happens. Depressing!
- Silver prices are erratic, and often bore us to tears before a massive rally. Later they deflate our expectations as prices collapse. Depressing and exciting!
- It’s not all death and despair. The silver price low occurred in December 2015. Politicians and bankers will continue devaluing all fiat currencies, and silver remains valuable and essential for modern life. Exciting!
- JPMorgan has amassed a hoard of physical silver bullion – for a compelling reason – greed. Very exciting! Read Ted Butler.
- The gold to silver ratio is high—about 80—which has indicated oversold conditions and silver rally zones in the past. Exciting!
- Silver prices have been so low for so long—under $22—since October 2013, that silver has “worn out” most investors. This market should explode higher – someday. Refer back to the graph of silver and M2, knowing M2 is as certain to increase as the sun will rise and politicians will demand payoffs. Depressing and Exciting!
Miles Franklin sells silver and gold. They can’t predict future silver prices, but they believe silver is valuable today and will be far more valuable, measured in devaluing fiat dollars, in several years.
Call them at 1-800-822-8080.
Gary Christenson

Gary Christenson is the owner and writer for the popular and contrarian investment site Deviant Investor and the author of several books, including “Fort Knox Down!” and “Gold Value and Gold Prices 1971 – 2021.” He is a retired accountant and business manager with 30 years of experience studying markets, investing, and trading. He writes about investing, gold, silver, the economy, and central banking. His articles are published on Deviant Investor as well as other popular sites such as 321gold.com, peakprosperity.com, goldseek.com, dollarcollapse.com, brotherjohnf.com, and many others.
deviantinvestor.com
| 


![[Most Recent Quotes from www.kitco.com]](http://www.kitconet.com/charts/metals/gold/t24_au_en_usoz_2.gif)
![[Most Recent USD from www.kitco.com]](http://www.weblinks247.com/indexes/idx24_usd_en_2.gif)
![[Most Recent Quotes from www.kitco.com]](http://www.kitconet.com/charts/metals/silver/t24_ag_en_usoz_2.gif)