
Send this article to a friend:
June
02
2021

|
Send this article to a friend: June |
|
Two Pins Threatening Multiple Asset Bubbles
The headline above is but one of countless times Fed Chairman Powell and his colleagues confidently said their policies do not result in wealth or income inequality. Their political stature and use of complex economic lingo give weight to their opinions in the media. Nevertheless, a deep examination of the Fed’s practices and their consequences leaves us to think otherwise. In our opinion, the Fed’s contribution to wealth inequality is significant and grossly misunderstood. We have written articles explaining why QE and low interest rates generally benefit the wealthy and harm the poor. This article backs up those prior arguments with quantitative muscle. Timely for investors, we also draw some lines between wealth inequality and financial stability and their relationship to monetary policy. We think it is becoming increasingly possible wealth inequality, and in particular, the outsized effect inflation has on the poor, could be the needle to pop many asset bubbles. The other possible needle is the Fed’s wanting for financial stability.
Background More inflation and financial stability (rising asset prices) are two of the three core tenets backing monetary policy. A strong labor market is the third objective. We focus on inflation in this article and financial stability in part II. In our article Two Percent for the One Percent, we explain why inflation is detrimental to the poor, while rising asset prices (financial stability) primarily benefit the wealthy. The following paragraphs from the article explain:
The Fed Craves More Inflation
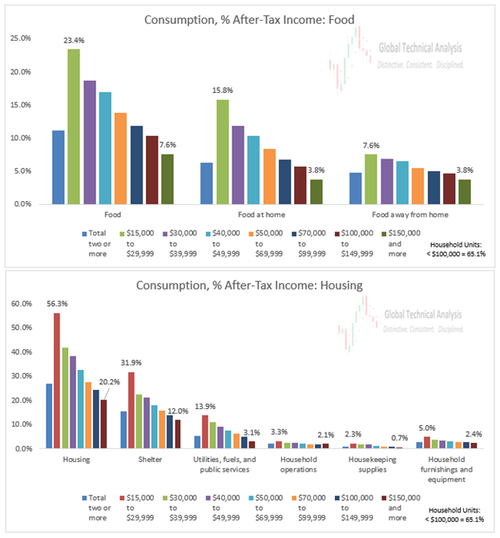
In no uncertain terms, Fed members make it clear, they want more price inflation. Unfortunately, inflation is not best for everyone. Inflation affects different income classes vastly differently. The disparity is most accentuated with necessities, such as food and housing prices. Food and Housing InflationSpending on food and shelter comprise over 75% of the after-tax income of the lowest income classes but only about 25% for the highest income classes. The graphs below, courtesy of Brett Freeze, compare food and shelter spending across multiple income classes. In each illustration, the bar chart on the left shows the total food or shelter expense as a percent of after-tax income. The charts to their right are the sub-components expenditures that comprise the total.
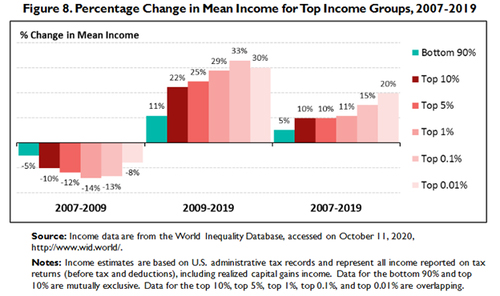
Over the last year, the BLS reported food and beverage prices rose at an average annual rate of 8.84%. For a family in the $15,000 – $29,999 income class, total spending would have to rise by 2.07% on average to consume the same amount of goods and services as a year ago. The increase only accounts for higher food prices. For the highest income class, their change was only .67%. Housing prices, over the same period, rose on average by 7.07%. For a family in the lowest income class, this one expense pushes their total expenses up by 3.98%. The families in the highest income class will pay 1.42% more. Only accounting for food and housing, two necessities, the lowest income classes saw their annual expenses rise by 6.05%. The highest income classes saw their expenses rise by 2.10%. Who Can Afford Inflation?The graph below, courtesy of Congressional Research Service – The U.S. Income Distribution: Trends and Issues, quantifies changes in income by income class. The data allows us to assess if wage inflation can offset price inflation. As shown, the lowest income group saw incomes rise by 11% over the period spanning 2009-2019. That equates to approximately 1% a year. The highest income group saw their income rise by about 3% a year over the same period.
The current annual increases in food and housing costs will require an additional 6.05% of income for the lowest wage earners to keep their financial position indifferent. Any amount less than that and they fall behind. Keep in mind that does not cover inflation for any other expenditures. Stimulus checks may fill the immediate gap, but in the long-run inflation makes their financial difficulties worse. The highest income earners will need to earn 2.10% more in income to cover recent price increases. Fortunately for them, that is below the recent rate of annual income increases. The data above is further affirmed by the latest BLS employment data released May 7, 2021. Per the BLS, wages rose 0.3% over the last year versus a 4.2% increase in CPI. Why Investors Should Care If the prices of food, shelter, and other necessities continue to surge higher without equivalent wage growth, wealth inequality will worsen. This problem represents a coming dilemma for the Fed. When the media and politicians take notice, they will pressure the Fed on their inflation stance. If the Fed is persuaded or even forced to act, bubbles driven by the latest round of excessive liquidity, are likely to deflate. Growing wealth inequality may be a needle in search of a bubble. Part two, coming next week, discusses the other needle looking for a bubble, financial stability.
|
Send this article to a friend:
 |
 |
 |


![[Most Recent Quotes from www.kitco.com]](http://www.kitconet.com/images/live/s_gold.gif)
![[Most Recent USD from www.kitco.com]](http://www.weblinks247.com/indexes/idx24_usd_en_2.gif)
![[Most Recent Quotes from www.kitco.com]](http://www.kitconet.com/images/live/s_silv.gif)