
Send this article to a friend:
April
28
2025

|
Send this article to a friend: April |
|
Oil priced in gold is near all-time lows
Crude oil priced in grams of gold has reached the second lowest level in history (see exhibit 1). The only time a gram of gold bought more oil was in March 2020, at the height of the COVID19 lockdowns when the world lost a record 30% of oil demand overnight. (As for comparison, at the peak of the 2008-2009 great financial crisis, global oil demand was down just 3%) Exhibit 1: The Oil-to-Gold ratio has dropped to the second lowest level of all time $/gram 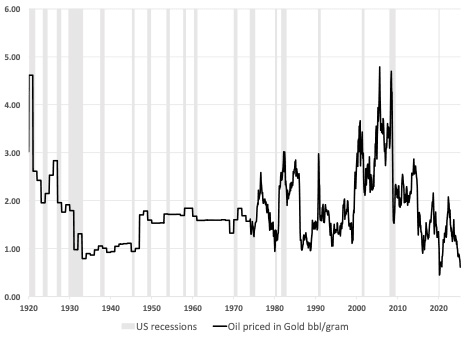
Source: Goldmoney Research Importantly, the reason for this is the record high gold price rather than low oil prices. While the risks of a recession have risen significantly on the back of the newly imposed US tariffs, oil demand has not been impacted yet. In fact, global oil demand is still at an all-time seasonal high (see exhibit 2). Exhibit 2: Oil demand has held up well despite the risk of a global recession Thousand b/d 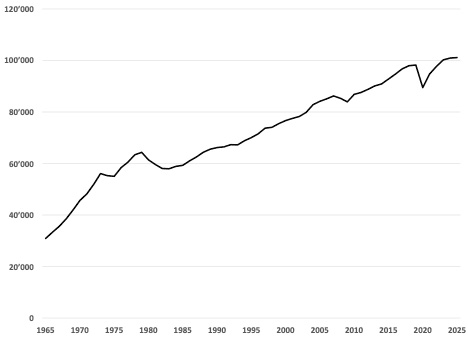
Source: Energy Institute, Goldmoney Research As oil demand has yet to show the impact of the tariffs and an eventual global recession, global oil inventories remain low and, thus, prices haven’t collapsed (see exhibit 3) Exhibit 3: Brent crude oil prices are still above $65/bbl despite significant recession risks $/bbl, Prompt month Brent prices 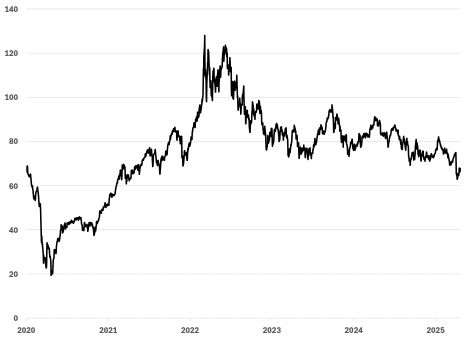
Source: Goldmoney Research In our view, gold and energy prices are intrinsically linked. As we have argued in our gold framework note (Gold Price Framework Vol. 2: The energy side of the equation, May 28.2018):
Thus, gold tends to move with changes in longer-dated energy prices and longer-dated energy prices change with the marginal costs of future production. The marginal cost of future production can change for two reasons:
The latter effect is what we have been witnessing lately. The recent rise in gold prices has materialised due to changes in the denominator (the dollar), as non-US central banks and sovereign wealth funds buying gold to diversify away from the dollar and other financial players buying gold to hedge against devaluation risks as inflation expectations soar. Over a decade of close to zero interest rates and relentless money printing in the form of QE have created a fertile ground for price inflation. In our view, the 2022-23 period was just the beginning of a prolonged inflation period and US households seem to agree. The University of Michigan 12-month inflation expectations shot back up to 4.3% (see exhibit 4). More shockingly, the 5-year Inflation Expectations Index rose to the highest levels since 1991. Exhibit 4: US Inflation Expectations are on the rise again % 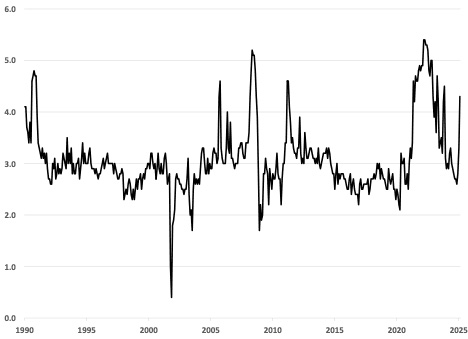
Source: FRED, Goldmoney Research Meanwhile long-term oil prices remain stuck in a $65-75 range (see exhibit 5) as ample spare capacity is providing a cushion against rising marginal costs of future supply and prompt prices coming under pressure from global growth repricing. Exhibit 5: Despite rising inflation expectations, longer-dated oil prices remain stuck in the $65-75/bbl range 5-year forward prices, $/bbl 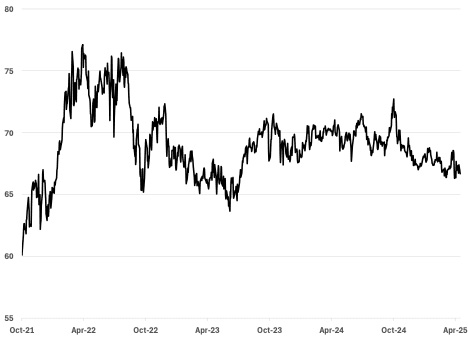
Source: Goldmoney Research In our view, long-term energy prices will eventually face the same upward pressure as costs will go up. This effect may play out faster than in the past as global production growth has been relying heavily on US shale oil, which at these price levels is unlikely to grow further. However, as the world is entering a recession, oil prices, including long-term prices, will likely come under even more pressure over the short term. Should gold prices not correct in a global recession, this would inevitably lead to a new low in the oil-to gold price ratio. Oil is not the only asset that is near the low end of the historical range when priced in gold. The picture looks somewhat similar for US property prices. Despite average home prices being over 50% higher than five years ago, and almost 100% compared to ten years ago, US property prices measured in gold are at the low end of the historical average (see exhibit 6). Exhibit 6: US home prices in ounces of gold are at the low end of the historical average Shiller US home prices index / gold 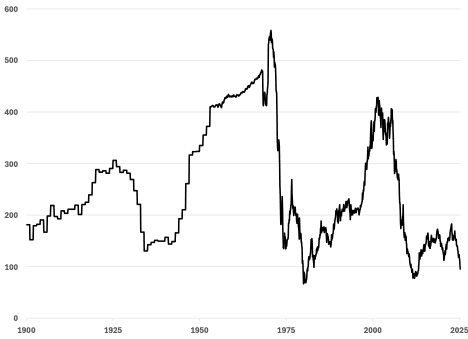
Source: Shiller data, Goldmoney Research This might come as a bit of a surprise to many, as the common perception is that home prices have spiraled out of control over the past years. The usual explanations for the relentless rise in property prices usually include lack of new builds and strong population growth. But as the home-price-to-gold-ratio suggests that this again is only a monetary phenomenon and high property prices simply reflect dollar devaluation. Hence, the current property-to-gold price ratio suggests that as gold prices continue to raise on the back of further dollar devaluation, so probably should property prices. The only exception at this point are equity prices. US stocks are still elevated vs historical levels when measured in gold (see exhibit 7). Exhibit 7: The US stock market priced in gold remains high compared to historical levels, especially in light of a potential recession this year SP500 in ounces of gold 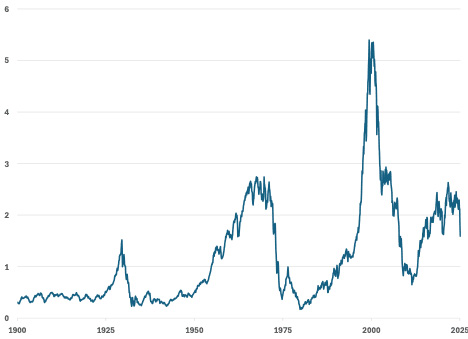
Source: Schiller Data, Goldmoney Research While the US equity market priced in gold is nowhere near the levels of the dot.com bubble, the equity-to-gold-ratio is still elevated compared to historical levels, and, thus, also elevated compared to stocks and oil prices. Hence, from a pure equity-to-gold-price-ratio, stocks have more downside form here, at least in real terms. Nevertheless, equities priced in gold don’t look nearly as extremely overvalued as when priced in dollars, where – despite the recent sell off - common stock valuations measures such as P/Es or market cap-to-GDP continue to signal extreme valuations. Hence, we believe that all the money creation over the past 15 years (or arguably longer) has initially impacted stocks and equities first without causing too much broad based inflation in goods and services. Subsequently, we saw a brief period of inflation from 2022-2023 where prices for goods and services rose sharply, but equities and property prices continued to rise. But that was also the starting point of the gold rally, and unlike normal goods and services, gold has continued to rise as it prices in future devaluation of the dollar. In our view, this is just the beginning, and we expect gold to outperform everything else in the medium term.
|
Send this article to a friend:
 |
 |
 |