
Send this article to a friend:
April
09
2019

|
Send this article to a friend: April |
|
The Price Of Inflation
The three previous financial crises in the U.S. had their own distinctive characteristics, individual stories, and villains attached to them. Yet, the underlying reason for all three was one and the same. After a near decade-long bull market, the mother of all financial bubbles has created catalysts for the next financial crisis that are ripe and ready to drop. Monetary inflation creates the breeding ground for what we commonly refer to as the catalysts of financial crises. It lays the foundation on which the building blocks of all financial crises are erected. In tandem with inflation, these catalysts multiply and grow large enough over time to create broad-based financial panics and major economic downturns. As an investor and protector of your own and perhaps others’ savings, you have an advantage to the degree you can identify the environment in which these catalysts first emerge and later mature. Today, these catalysts, whatever they might turn out to be, are ripe and ready to drop at any time. Inflation comes at a very high price, literally speaking, but usually subtly enough and sufficiently gradually for the majority not to become alarmed or concerned enough to bother. That price is a reduction in purchasing power for most people, partly evidenced by an ever-growing dependence on debt, and the notorious business cycle. The loss in purchasing power also creates a breeding ground for social discontent and, in due course, can lay the foundation even for revolutions. These days, politicians and government officials frequently refer to this societal problem simply as inequality, a highly misguided phrase concealing, perhaps intentionally, that it is the very government policies enacted in the first place that helped create it. In today’s fiat money world, where the legally enforced money employed is based on, and linked with, absolutely nothing of real value (even the good faith of the government is at best questionable), even the slightest of changes in the quantity of money would lead the economy astray from its ever-present quest towards equilibrium. Smaller changes though do tend to go largely unnoticed, at least sufficiently enough for central banks to continue their reckless policies which feed on peoples’ incomes and savings. This helps explains why central banks around the world have set their inflation targets mostly in the 2-3% range. But these inflation targets come, in addition to being hopelessly contradictory given central bank mandates, with a big caveat; they are measured against government-produced statistics of consumer price inflation, which have a strong downward bias in many calculations, and not monetary inflation. This is an important distinction, since the latter is inflation while the former is merely one of the symptoms of inflation. Official measures of consumer price inflation, for obvious monetary policy reasons as it allows governments to finance their deficits and banks to expand their balance sheets and profits, omit, among other things, house prices and risk-asset prices. Both are sectors of an economy where a not insignificant chunk of the inflation on the way up, and the deflation on the way down, always shows up.
Government CPI statistics are therefore not only usually understated during the expansionary phase but also fail to capture the cyclical nature of fiat money regimes in general.
The various currencies employed around the world today are useless as a store of value, an economic issue that is substantially larger than most seem to acknowledge and only a minority seem to care about. Perhaps they underestimate the issue because they wrongly draw their inferences, if any, from foreign exchange rates. Or perhaps the money illusion have kept them from noticing as their assets have greatly appreciated since those miserable days over a decade ago. Yet, fewer people recognize that a major chunk of house and financial asset price increases stems not from a surge in the intrinsic value of those assets, but instead from a loss in value of the currencies they are traded and quoted in. For most people, this distinction has little practical value, but the bottom line is that coordinated inflation helps conceal the very real, and considerable, loss in purchasing power of all currencies that has been ongoing for decades - a concealment that will not last indefinitely.
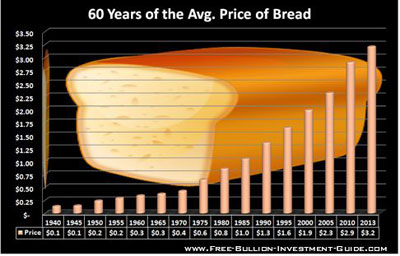
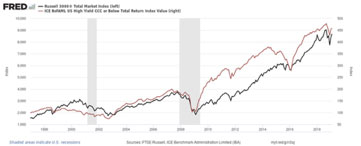
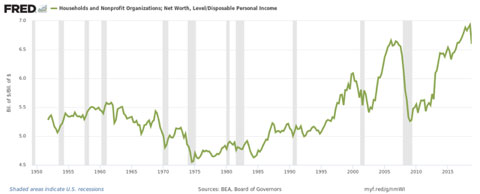
Government institutions, domestic as well as global, gain, while individual tax payers' savings, as a consequence, deplete with time. Capital goods investments suffer thereafter. Combined, depleted savings and a reduction in the level of investments also negatively affect economic growth. At first it stalls, then later falls leading to an economic regression that cannot be cured with more of what helped stop it in the first place; inflation. But inflation does more damage than slowly destroying purchasing power and savings while simultaneously hampering economic growth; it creates the notorious business cycle. The ups and downs of the business cycle has dire consequences for citizens, especially those in the private sector, as it always culminates with a portion of economic resources being allocated to areas in the economy where a market left to its own devices never would even contemplate. Misallocation of resources is the result. Increases in unsustainable economic activity (increased spending and investment financed by money creation) follows at the expense of economic growth (increased spending and investment financed by production and savings, which is sustainable). When the former runs out of credit, which it simply must do at some stage as long as central banks care about avoiding hyperinflation and keeping the banking sector afloat, both collapse. This is when risk-asset prices plunge, financial crises erupt, and governments and especially central banks panic as this, a well-established tradition by now, comes as yet another surprise. Phantom profits has turned to real losses, and cries for government and central bank intervention are heard from all corners of the banking sector and others that would never be open for "business" without. Investors with reasonable minds and realistic expectations for the longer term know that the bull market in at least U.S. stocks and corporate bonds are long overdue a reversal in fortunes of historic proportions. The million-dollar questions on these investors’ minds are naturally the what and the when; what will trigger the next crash and when. Get both right, and you will make hefty returns if you put your money where your mouth is. But it is really the question related to the when that is the more important one of the two since almost any catalyst capable of rocking market confidence in an economy built on the shaky foundations of today’s monetary regime might just do the trick at the height of a bull market when confidence, and extrapolation of expectations that previously have been met and often exceeded, is the last man standing. And here we come to an important truth about financial bubbles, namely that debt expansion can simply go bust under its own weight, an inevitable outcome of credit expansions unbacked by a commensurate amount of savings. The economic distortions inflation foster will, on the face of it, appear to be different every time, partly due to the new regulations that are passed following each crisis. So too will hence the eventual catalyst that will be deemed to have caused the bust. Well-known examples from the U.S. are the savings & loans crisis, the dotcom bubble and the collapse of subprime MBSs, all of which had their own distinctive characteristics and individual stories and villains attached to them. Yet, the underlying reason for all three was one and the same; debt expansions dislocated from savings which made overconsumption, malinvestments, asset speculation, and weakening bank balance sheets all possible simultaneously. In other words, there would be no catalyst available in the first place to trigger these crises, or a financial crisis in general, in the absence of easy money, certainly not on the scale we have become more than familiar with. For that reason, when the environment is primed, a catalyst of some sort, any sort and at some stage, simply will be unleashed and receive all of the attention and most of the blame for the crisis. Thus, if you can identify the economic environment in which catalysts thrive, you can predict that a catalyst will eventually trigger an economic downturn or a stock market crash. This might prove a valuable addition to your investor tool kit. Everything is, as has been demonstrated on many occasions in recent decades, connected in the world of finance and fractional reserve banking. Large chunks of the system will, by default, consequently collapse when the shaky foundations monetary regimes are built on jitters. Specifically, this shaky foundation is the elastic currencies employed around the world today that by their very existence are responsible for creating these so-called catalysts, i.e. the mere symptoms that are incorrectly confused with causes. In other words, the very design of the monetary and banking system is flawed and doomed to create financial volatility and serious economic problems. The mainstream's notion of an “exogenous shock” which, allegedly alone and totally unpredictably, can cause an economic meltdown and a market crash, is therefore anything but. It is instead a human-made feature of the monetary system itself that we could, if we so desired on a wide enough scale, put an end to. Identifying the environment where catalysts thrive is arguably not the most challenging task. This award instead goes to spotting the when, with some certainty, that the market has had enough of the phoney money and false long term promises of prosperity thrown at it. Regrettably, this is an area where economic science ends and the art, that in part comes with experience, takes over. Your willingness to take risk at this stage also matters. Still, even the most experienced are often way too early in their calls for a correction, many of whom sound like broken records these days. But these “doomsayers” will be vindicated soon enough as this is no Goldilocks economy, unless of course you judge an economy based on stock market performance and debt growth. The lesson however is not to depend on perfection when it comes to timing the downturn, but instead use your knowledge about probable inflections points on the horizon to adjust your asset allocations accordingly. Generally speaking, this means allocating a smaller proportion of your investment portfolio to risk assets when valuations are high, the upside appear limited and the downside substantial. When, additionally, the economy seems fragile and valuations have long since disconnected from a wide range of economic fundamentals, warning bells should be chiming. And chiming they have, for a couple of years, but now they are chiming louder and clearer than at any stage during the last decade. Such is the case with the U.S. markets today, alongside many others, where yield-starved investors, thanks to almost a decade with zero-interest rate policies, have been pushed much further out on the risk curve than they belong, especially if they plan to survive. And they have been richly rewarded thus far, many mostly unaware or even ignorant of the great risks they have assumed along the way. The simple chart below is therefore by itself a sign of an economy in a state where potential catalysts flourish.
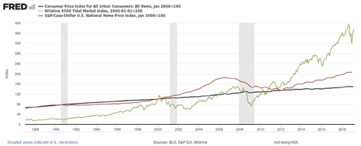
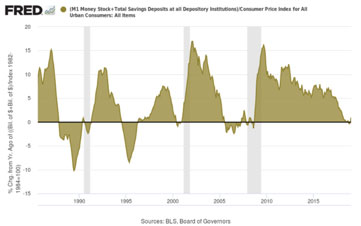
Naturally, value investors and fundamental analysts may argue, for fair reasons, that a price chart alone says nothing about valuation levels and risks. In part, that is of course true, but bear in mind that both the nominator and denominator of conventional valuation multiples can be inflated at the same time. The price-earnings ratio is but one example, where an inflated denominator may depress the P/E ratio and thus falsely signal that a particular stock or the market as a whole is not that expensive. We cannot, however, escape the truth that risk-asset prices could never move ever-higher on a broad scale in the absence of persistent increases in monetary inflation and, to some extent and relatively speaking, muted price inflation. This kind of development, depicted in the chart below, is actually captured quite well by a simple price chart like the one above.
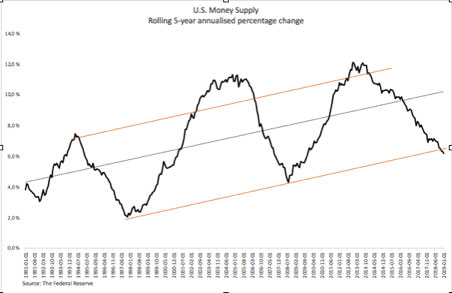
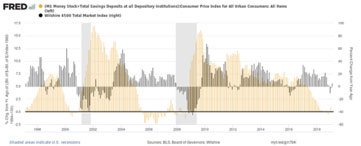
In general, monetary inflation outpacing official measures of price inflation is good news for the stock market and corporate bond market for two key reasons. Firstly, monetary inflation tends to also inflate corporate earnings, allowing especially stock prices to inflate even with a declining P/E ratio. Secondly, low price inflation supports further accommodative monetary policies while simultaneously contributing to lower interest rates and return on capital requirements, in part due to a subdued price inflation component. The two reasons lead to a general conclusion: the larger the spread between monetary inflation and official measures of price inflation, the faster this spread grows and the longer it lasts, the better for risk-assets in general, especially lower quality stocks and corporate bonds. Market expectations, which are frequently more powerful than hard fundamentals, can exacerbate or alleviate the affect the spread alone has on the economy and markets. With this in mind, the chart above highlights an important reason, and a necessary condition, for why the U.S. bull market has continued for the great majority of the last decade. But on this count, things have finally been changing and have again, as in previous cycles, been heading in the wrong direction for the bulls for some time. Recently the ratio in the chart above moved into red-flag territory when its growth rate turned negative for the first time since September 2008, the very month Lehman Brothers filed for bankruptcy and financial markets collapsed. Given that the leads and lags differ from cycle to cycle, one should not lay too much into the exact relevance of this observation. But theory, and the previous two financial crises in the U.S., tell us it might just matter when this ratio hits zero or less after previously being well above for a longer period. This is shown in the chart below, which juxtaposes the year on year percentage change in a broad U.S. stock market index to the chart above.
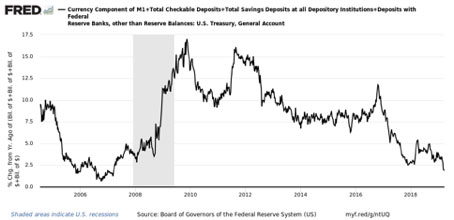
The chart shows the growth rate in the money supply to CPI ratio heading down well ahead of the stock market both in the run-up to the dotcom crisis in 2000 and the 2008 financial crisis. Each time, the two hovered around zero growth for a while, haven fallen from elevated levels for some time, before the stock market tanked. This was followed by, on both occasions, a sharp rebound in the ratio, at first due to the price deflation typically associated with a GDP recession. And now the pattern is repeating itself once again; the ratio has fallen sharply since an intermediate peak in late 2016 and have been hovering around zero or below since last summer. Stock market returns on the other hand started turning less positive a few months after. Returns, here measured on a year on year basis, then finally turned negative in December last year for the first time since early 2016. Now, we have no precise way of knowing how long it will take the stock market to surrender, or even if the ratio will head up again to prolong the bull market. But we do know this; economic theory and experience from at least the previous two crises tell us current developments are warning signs for risk asset returns in general. In other words, the U.S. economy is once again ripe for a catalyst of some sort to trigger the next financial crisis. Though leads and lags differ in each cycle as mentioned earlier, it is no mere coincidence that the U.S. stock market capitulated after the ratio above first dropped during the previous two downturns. After all, what goes up due to increased monetary inflation must come down when the inflation decelerates. And decelerate it must at some stage. If it never did, the Federal Reserve would risk being held responsible for runaway price inflation and potentially the collapse of the U.S. monetary system. The Fed is not about to let that happen any time soon. In fact, it is allowing the exact opposite to happen as monetary inflation has now hit the lowest level since the run-up to the financial crisis.
Nor will it probably implement QE 4 until a recession has been called and financial markets have already crumbled. This leaves risk assets in a very vulnerable spot. So, it seems, risk assets are at the mercy of further dovish Fed guidance and increased money supply growth to keep the markets bullish and liquid enough. When either folds, as the latter is in the process of doing, it is game over for this cycle. As the money illusion will soon again prove to be just that, the true price of inflation will once again be obvious for most to see; a loss in purchasing power, a loss of job opportunities, and a net worth that could not be relied upon, just to mention a few.
The debt burden, however, will again prove to be not only real but also substantially more expensive than initially planned and hoped. Disclosure: I am/we are long MYY. I wrote this article myself, and it expresses my own opinions. I am not receiving compensation for it (other than from Seeking Alpha). I have no business relationship with any company whose stock is mentioned in this article.
Atle Willems, author of "Money Cycles", is an analyst with Liabridge Economic Research.
|
Send this article to a friend:
 |
 |
 |

![[Most Recent Quotes from www.kitco.com]](http://www.kitconet.com/charts/metals/gold/t24_au_en_usoz_2.gif)
![[Most Recent USD from www.kitco.com]](http://www.weblinks247.com/indexes/idx24_usd_en_2.gif)
![[Most Recent Quotes from www.kitco.com]](http://www.kitconet.com/charts/metals/silver/t24_ag_en_usoz_2.gif)