
Send this article to a friend:
April
08
2019

|
Send this article to a friend: April |
|
Why and How Capitalism Needs to Be Reformed (Part 1)
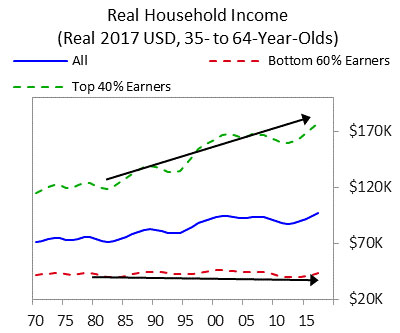
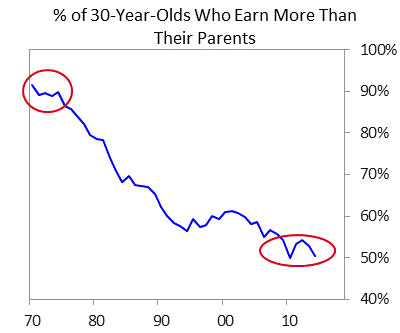
Summary I was fortunate enough to be raised in a middle-class family by parents who took good care of me, to go to good public schools, and to come into a job market that offered me equal opportunity. I was raised with the belief that having equal opportunity to have basic care, good education, and employment is what is fair and best for our collective well-being. To have these things and use them to build a great life is what was meant by living the American Dream. At age 12 one might say that I became a capitalist because that’s when I took the money I earned doing various jobs, like delivering newspapers, mowing lawns, and caddying and put it in the stock market when the stock market was hot. That got me hooked on the economic investing game which I’ve played for most of the last 50 years. To succeed at this game I needed to gain a practical understanding of how economies and markets work. My exposure to most economic systems in most countries over many years taught me that the ability to make money, save it, and put it into capital (i.e., capitalism) is the most effective motivator of people and allocator of resources to raise people’s living standards. Over these many years I have also seen capitalism evolve in a way that it is not working well for the majority of Americans because it's producing self-reinforcing spirals up for the haves and down for the have-nots. This is creating widening income/wealth/opportunity gaps that pose existential threats to the United States because these gaps are bringing about damaging domestic and international conflicts and weakening America’s condition. I think that most capitalists don’t know how to divide the economic pie well and most socialists don’t know how to grow it well, yet we are now at a juncture in which either a) people of different ideological inclinations will work together to skillfully re-engineer the system so that the pie is both divided and grown well or b) we will have great conflict and some form of revolution that will hurt most everyone and will shrink the pie. I believe that all good things taken to an extreme can be self-destructive and that everything must evolve or die. This is now true for capitalism. In this report I show why I believe that capitalism is now not working for the majority of Americans, I diagnose why it is producing these inadequate results, and I offer some suggestions for what can be done to reform it. Because this report is rather long, I will present it in two parts: part one outlining the problem and part two offering my diagnosis of it and some suggestions for reform. Why and How Capitalism Needs to Be Reformed Before I explain why I believe that capitalism needs to be reformed, I will explain where I’m coming from, which has shaped my perspective. I will then show the indicators that make it clear to me that the outcomes capitalism is producing are inconsistent with what I believe our goals are. Then I will give my diagnosis of why capitalism is producing these inadequate outcomes and conclude by offering some thoughts about how it can be reformed to produce better outcomes. As there is a lot in this, I will present it in two parts, releasing Part 1 today and Part 2 tomorrow. Part 1 Where I’m Coming From I was lucky enough to grow up in a middle-class family raised by parents who cared for me, to be educated in a good public school, and to be able to go into a job market that offered me equal opportunity. One might say that I lived the American Dream. At the time, I and most everyone around me believed that we as a society had to strive to provide these basic things (especially equal education and equal job opportunity) to everyone. That was the concept of equal opportunity, which most people believed to be both fair and productive. I suppose I became a capitalist at age 12 because that’s when I took the money I earned from doing various jobs like delivering newspapers, mowing lawns, and caddying, and put it in the stock market when the stock market was hot in the 1960s. That got me hooked on the investing game. I went to college and graduate school even though I didn’t have enough money to pay the tuitions because I could borrow the money from a government student loan program. Then I entered a job market that provided me equal opportunity, and I was on my way. Because I loved playing the markets I chose to be a global macro investor, which is what I’ve been for about 50 years. That required me to gain a practical understanding of how economies and markets work. Over those years, I’ve had exposure to all sorts of economic systems in most countries and have come to understand why the ability to make money, save it, and put it into capital (i.e., capitalism) is an effective motivator of people and allocator of resources that raises people’s living standards. It is an effective motivator of people because it rewards people for their productive activities with money that can be used to get all that money can buy. And it is an effective allocator of resources because the creation of profit requires that the output created is more valuable than the resources that go into creating it. Being productive leads people to make money, which leads them to acquire capital (which is their savings in investment vehicles), which both protects the saver by providing money when it is later needed and provides capital resources to those who can combine them with their ideas and convert them into the profits and productivities that raise our living standards. That is the capitalist system. Over those many years, I have seen communism come and go and have seen that all countries that made their economies work well, including “communist China,” have made capitalism an integral part of their systems for these reasons. Communism’s philosophy of “from each according to his ability, to each according to his needs” turned out to be naïve because people were not motivated to work hard if they didn’t get commensurately rewarded, so prosperity suffered. Capitalism, which connects pay to productivity and creates efficient capital markets that facilitate savings and the availability of buying power to fuel people’s productivity, worked much better. I’ve also studied what makes countries succeed and fail by taking a mechanistic perspective rather than an ideological one because my ability to deal with economies and markets in a practical way is what I have been scored on. If you’d like to see a summary of my research that shows what makes countries succeed and fail, it’s here (link). In a nutshell, poor education, a poor culture (one that impedes people from operating effectively together), poor infrastructure, and too much debt cause bad economic results. The best results come when there is more rather than less of: a) equal opportunity in education and in work, b) good family or family-like upbringing through the high school years, c) civilized behavior within a system that most people believe is fair, and d) free and well-regulated markets for goods, services, labor, and capital that provide incentives, savings, and financing opportunities to most people. Naturally, I have watched these things closely over the years in all countries, especially in the US. I will now show the results that our system is producing that have led me to believe capitalism isn’t working well for most Americans. Why I Believe That Capitalism Is Not Working Well for Most Americans In this section, I will show you a large batch of stats and charts that paint the picture. Perhaps there are too many for your taste. If you feel that you’re getting past the point of diminishing returns, I suggest that you either quickly scan the rest by just reading the sentences in bold or skip ahead to the next section which explains why I think that not reforming capitalism would be an existential threat to the US. To begin, I’d like to show you the differences that exist between the haves and the have-nots. Because these differences are hidden in the averages, I broke the economy into the top 40% and the bottom 60% of income earners.[1] That way we could see what the lives of the bottom 60% (i.e., the majority) look like and could compare them with those of the top 40%. What I found is shown in this study. While I suggest that you read it, I will quickly give you a bunch of stats that paint the picture here. There has been little or no real income growth for most people for decades. As shown in the chart below on the left, prime-age workers in the bottom 60% have had no real (i.e., inflation-adjusted) income growth since 1980. That was at a time when incomes for the top 10% have doubled and those of the top 1% have tripled.[i] As shown in the chart to the right, the percentage of children who grow up to earn more than their parents has fallen from 90% in 1970 to 50% today. That’s for the population as a whole. For most of those in the lower 60%, the prospects are worse.
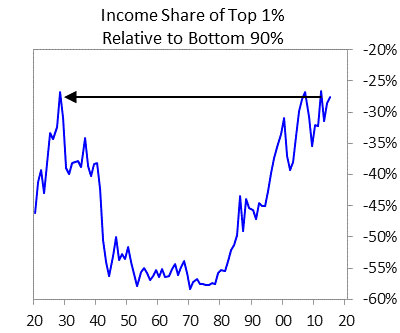
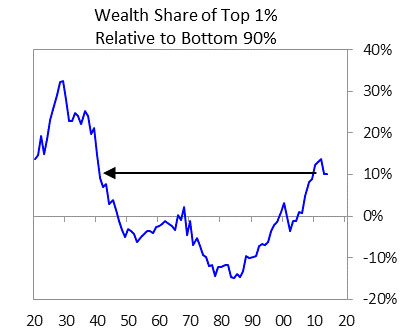
As shown below, the income gap is about as high as ever and the wealth gap is the highest since the late 1930s. Today, the wealth of the top 1% of the population is more than that of the bottom 90% of the population combined, which is the same sort of wealth gap that existed during the 1935-40 period (a period that brought in an era of great internal and external conflicts for most countries). Those in the top 40% now have on average more than 10 times as much wealth as those in the bottom 60%.[iv] That is up from six times in 1980.
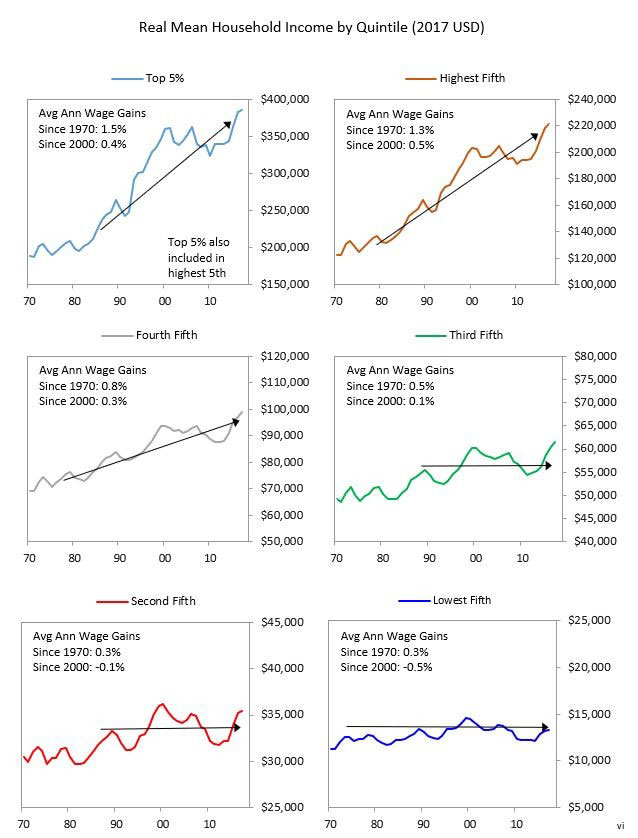
The following charts show real income growth by quintiles for the overall population since 1970. Ask yourself which one you’re in. That probably has given you your perspective. My objective is to show you the broader perspective.
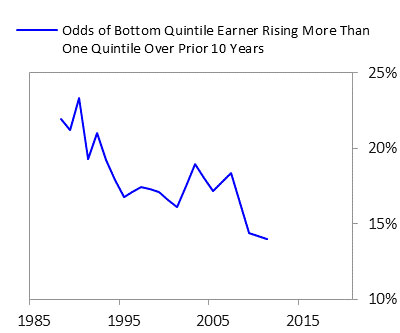
Most people in the bottom 60% are poor. For example, only about a third of the bottom 60% save any of their income in cash or financial assets.[vii] According to a recent Federal Reserve study, 40% of all Americans would struggle to raise $400 in the event of an emergency.[viii] And they are increasingly getting stuck being poor. The following chart shows the odds of someone in the bottom quintile moving up to the middle quintile or higher in a 10-year period. Those odds declined from about 23% in 1990 to only 14% as of 2011.
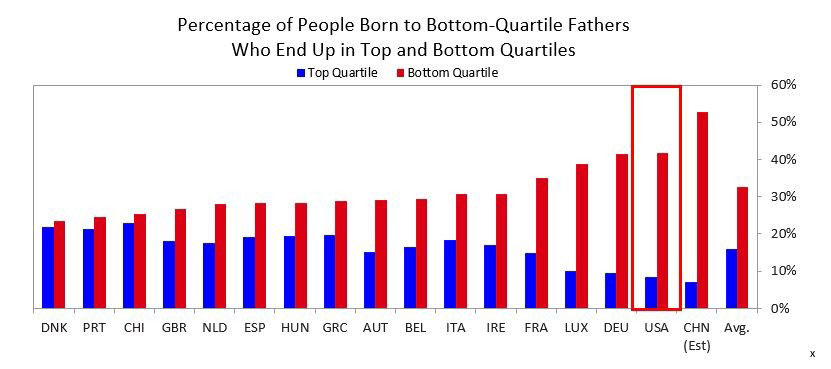
While most Americans think of the US as being a country of great economic mobility and opportunity, its economic mobility rate is now one of the worst in the developed world for the bottom. As shown below, in the US, people in the bottom income quartile have a 40% chance of having a father in the bottom quartile (in the father’s prime earning years) and people in the top quartile have only about an 8% chance of having a father in the bottom quartile, suggesting half of the average probability of moving up and one of the worst probabilities of the countries analyzed. In a country of equal opportunity, that would not exist.
One’s income growth results from one’s productivity growth, which results from one’s personal development. So let’s look at how we are developing people. Let’s start with children. To me, the most intolerable situation is how our system fails to take good care of so many of our children. As I will show, a large number of them are poor, malnourished (physically and mentally), and poorly educated. More specifically:
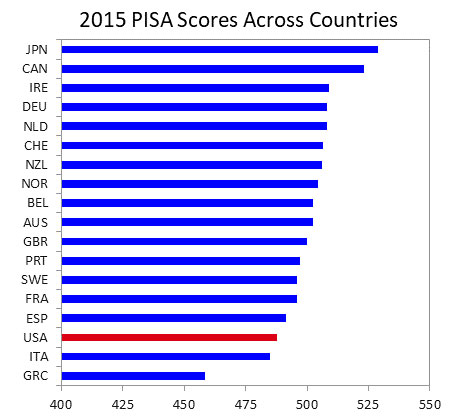
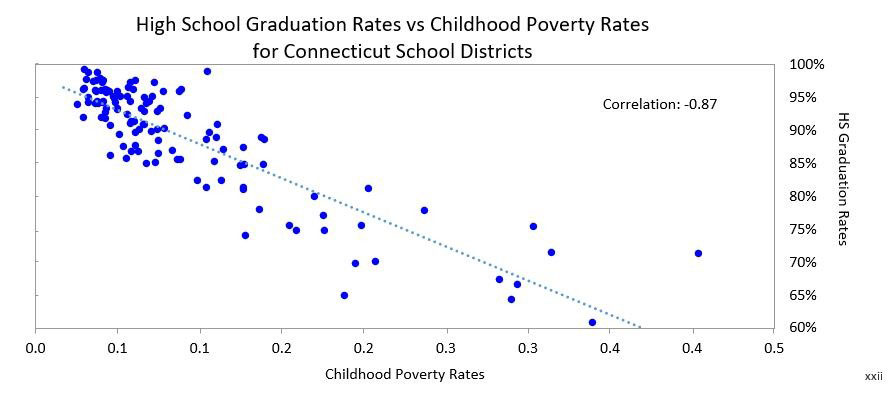
The domino effects of these conditions are costly. Low incomes, poorly funded schools, and weak family support for children lead to poor academic achievement, which leads to low productivity and low incomes of people who become economic burdens on the society. Though there are bright spots in the American education system such as our few great universities, the US population as a whole scores very poorly relative to the rest of the developed world in standardized tests for a given education level. More specifically:
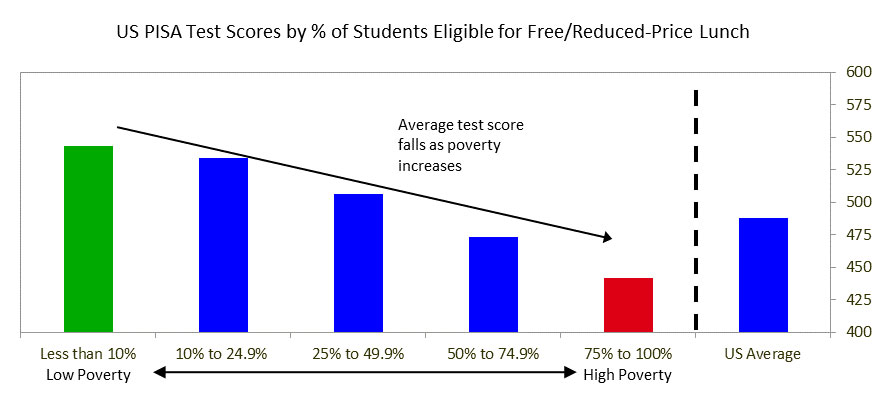
Differences in these scores are tied to poverty levels—i.e., high-poverty schools (measured by the share of students eligible for free/reduced-price lunch) have PISA test scores around 25% lower than schools with the lowest levels of poverty.
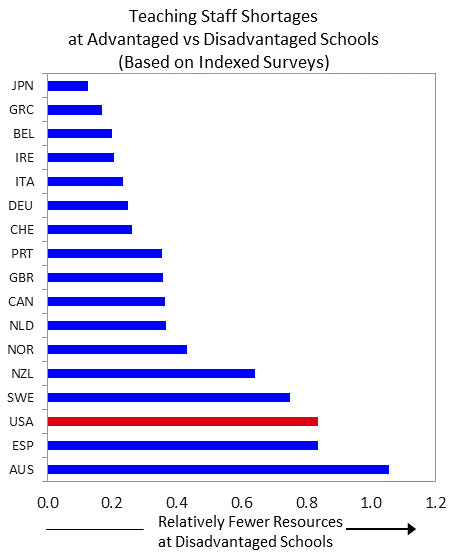
The stats that show that the US does a poor job of tending to the needs of its poor students relative to how most other countries do it are never-ending. Here are a few more:
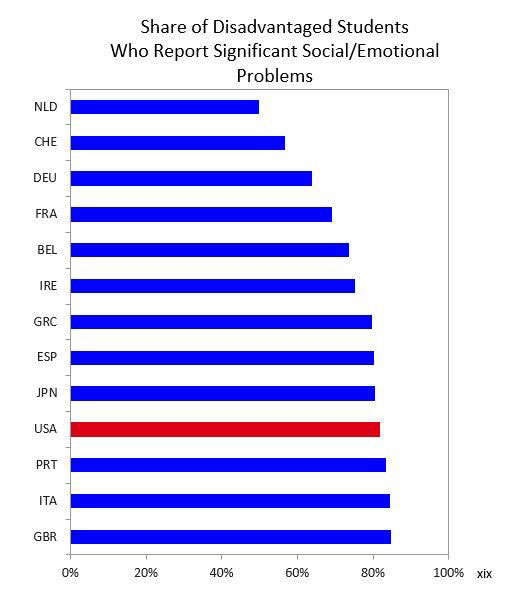
These poor educational results lead to a high percentage of students being inadequately prepared for work and having emotional problems that become manifest in damaging behaviors. Disadvantaged students in the US are far more likely to report social and/or emotional issues than in most other developed countries, including not being socially integrated at school, severe test anxiety, and low satisfaction with life.
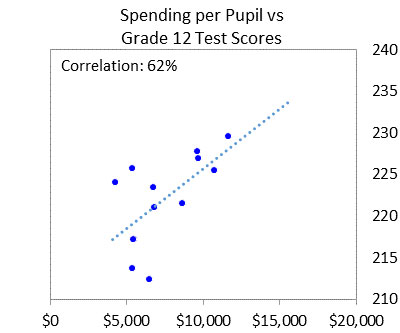
Scatters of Educational Spending and Outcomes for US States
The income/education/wealth/opportunity gap reinforces the income/education/wealth/opportunity gap:
To me, leaving so many children in poverty and not educating them well is the equivalent of child abuse, and it is economically stupid. The weakening of the family and good parental guidance has also been an important adverse influence: Here are a few stats that convey how the family unit has changed over the years:
Bad childcare and bad education lead to badly behaved adults hence higher crime rates that inflict terrible costs on the society:
The health consequences and economic costs of low education and poverty are terrible:
These conditions pose an existential risk for the US. The previously described income/wealth/opportunity gap and its manifestations pose existential threats to the US because these conditions weaken the US economically, threaten to bring about painful and counterproductive domestic conflict, and undermine the United States’ strength relative to that of its global competitors. These gaps weaken us economically because:
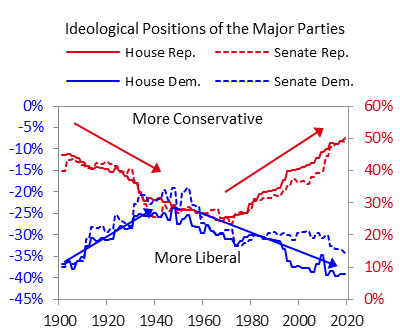
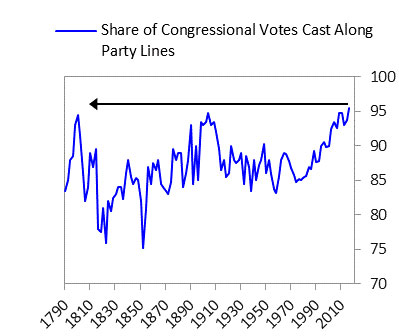
In addition to social and economic bad consequences, the income/wealth/opportunity gap is leading to dangerous social and political divisions that threaten our cohesive fabric and capitalism itself. I believe that, as a principle, if there is a very big gap in the economic conditions of people who share a budget and there is an economic downturn, there is a high risk of bad conflict. Disparity in wealth, especially when accompanied by disparity in values, leads to increasing conflict and, in the government, that manifests itself in the form of populism of the left and populism of the right and often in revolutions of one sort or another. For that reason, I am worried what the next economic downturn will be like, especially as central banks have limited ability to reverse it and we have so much political polarity and populism. The problem is that capitalists typically don’t know how to divide the pie well and socialists typically don’t know how to grow it well. While one might hope that when such economic polarity and poor conditions exist, leaders would pull together to reform the system to both divide the economic pie and make it grow better (which is certainly doable and the best path), they typically become progressively more extreme and fight more than cooperate. In order to understand the phenomenon of populism, two years ago I did a study of it in which I looked at 14 iconic cases and observed the patterns and the forces behind them. If you are interested in it, you can read it here. In brief, I learned that populism arises when strong fighters/leaders of the right or of the left who are looking to fight and defeat the opposition come to power and escalate their conflict with the opposition, which typically galvanizes around comparably strong/fighting leaders. The most important thing to watch as populism develops is how conflict is handled—whether the opposing forces can coexist to make progress or whether they increasingly “go to war” to block and hurt each other and cause gridlock. In the worst cases, this conflict causes economic problems (e.g., via paralyzing strikes and demonstrations) and can even lead to moves from democratic leadership to autocratic leadership as happened in a number of countries in the 1930s. We are now seeing conflicts between populists of the left and populists of the right increasing around the world in much the same way as they did in the 1930s when the income and wealth gaps were comparably large. In the US, the ideological polarity is greater than it has ever been and the willingness to compromise is less than it’s ever been. The chart on the left shows how conservative Republican senators and representatives have been and how liberal Democratic senators and representatives have been going back to 1900. As you can see, they are each more extreme and they are more divided than ever before. The chart on the right shows what percentage of them have voted along party lines going back to 1790, which is now the greatest ever. In other words, they have more polar extreme positions and they are more solidified in those positions than ever. And we are coming into a presidential election year. We can expect a hell of a battle.
It doesn’t take a genius to know that when a system is producing outcomes that are so inconsistent with its goals, it needs to be reformed. In the next part, I will explore why it is producing these substandard outcomes and what I think should be done to reform it. You can find the full report (Part 1 & Part 2) here: https://www.linkedin.com/pulse/why-how-capitalism-needs-reformed-parts-1-2-ray-dalio/?published=t [1] Actually, we broke it into many other subcategories and then aggregated them into these two groups for simplicity in presenting the results. [i] https://wir2018.wid.world/part-2.htmldata [ii] Based on data from the Current Population Survey. https://cps.ipums.org/cps/ [iii] http://www.equality-of-opportunity.org/papers/abs_mobility_paper.pdf, 34. [iv] As of 2016; based on data from Survey of Consumer Finances. [v] Income chart (on left) shows fiscal income shares. Data from World Inequality Database. (https://wid.world/country/usa/) [vi] Data from Census Bureau [vii] As of 2016; based on data from Survey of Consumer Finances. [viii] Survey of Consumer Finances (https://www.federalreserve.gov/publications/files/2017-report-economic-well-being-us-households-201805.pdf) [ix] https://www.minneapolisfed.org/institute/working-papers/17-06.pdf [x] https://www.oecd.org/social/soc/Social-mobility-2018-Overview-MainFindings.pdf; estimates for China based on Kelly Labar, “Intergenerational Mobility in China”, (https://halshs.archives-ouvertes.fr/halshs-00556982/document). Note that methodologies varied between countries in the OECD study. [xi] US Census Bureau, Current Population Survey, 1960 to 2018 Annual Social and Economic Supplements, History Poverty Tables, Table 3.(https://www.census.gov/data/tables/time-series/demo/income-poverty/historical-poverty-people.html) [xii] https://www.ers.usda.gov/webdocs/publications/90023/err-256.pdf, 10. [xiii] https://www.weforum.org/agenda/2017/06/these-rich-countries-have-high-levels-of-child-poverty/ [xiv] http://www.oecd.org/pisa/data/ [xv] http://www.oecd.org/pisa/data/ [xvi] OECD (2016), PISA 2015 Results (Volume I): Excellence and Equity in Education, PISA, OECD Publishing, Paris, 231. http://dx.doi.org/10.1787/9789264266490-en [xvii] OECD (2017), Educational Opportunity for All: Overcoming Inequality throughout the Life Course, OECD Publishing, Paris, 46. http://dx.doi.org/10.1787/9789264287457-en [xviii] OECD (2017), Educational Opportunity for All: Overcoming Inequality throughout the Life Course, OECD Publishing, Paris, 60. http://dx.doi.org/10.1787/9789264287457-en [xix] http://www.oecd.org/pisa/data/ [xx] http://new.every1graduates.org/wp-content/uploads/2018/09/Data-Matters_083118_FINAL-2.pdf [xxii] Poverty data from Census Bureau SAIPE School District Estimates (https://www.census.gov/data/datasets/2013/demo/saipe/2013-school-districts.html); graduation rates from Hechinger Report (https://hechingerreport.org/the-gradation-rates-from-every-school-district-in-one-map/) [xxiii] Note: Spending data is from the US Census Bureau and is current as of 2016. Test scores and proficiency data are from “National Report Card” assessments and are meant to be comparable across states. Data is from 2013. Only a limited sample of states have data for this Grade 12 assessment. [xxiv] https://www.cbpp.org/research/food-assistance/snap-is-linked-with-improved-nutritional-outcomes-and-lower-health-care [xxv] https://blogs.wsj.com/economics/2014/10/07/sat-scores-and-income-inequality-how-wealthier-kids-rank-higher/ [xxvi] https://cepa.stanford.edu/sites/default/files/reardon%20whither%20opportunity%20-%20chapter%205.pdf , 8. [xxvii] https://edtrust.org/wp-content/uploads/2014/09/FundingGapReport_2018_FINAL.pdf, 4. [xxviii] https://edtrust.org/wp-content/uploads/2014/09/FundingGapReport_2018_FINAL.pdf, 7. [xxix] https://www.usatoday.com/story/money/personalfinance/2018/05/15/nearly-all-teachers-spend-own-money-school-needs-study/610542002/ [xxx] OECD (2017), "D3.2a. Teachers' actual salaries relative to wages of tertiary-educated workers (2015)", in The Learning Environment and Organisation of Schools, OECD Publishing, Paris, https://doi.org/10.1787/eag-2017-table196-en. [xxxi] https://www.epi.org/publication/teacher-pay-gap-2018/ [xxxii] https://nces.ed.gov/programs/coe/indicator_cma.asp [xxxiii] Data based on Consumer Expenditure Survey [xxxiv] http://www.oecd.org/pisa/data/ [xxxv] Private school spending data from: https://www.nais.org/statistics/pages/nais-independent-school-facts-at-a-glance/ ; Public school spending data from: https://www.statista.com/statistics/203118/expenditures-per-pupil-in-public-schools-in-the-us-since-1990/ [xxxvi] http://www.oecd.org/pisa/data/ [xxxvii] https://news.gallup.com/poll/1612/education.aspx [2] The remaining 14% lived with two parents in remarriages. [xxxviii] http://www.pewsocialtrends.org/2015/12/17/1-the-american-family-today/ [xxxix] https://www.brookings.edu/research/twelve-facts-about-incarceration-and-prisoner-reentry/, 10 [xli] The Pew Charitable Trusts, Collateral Costs: Incarceration’s Effect on Economic Mobility, https://www.pewtrusts.org/~/media/legacy/uploadedfiles/pcs_assets/2010/collateralcosts1pdf.pdf, 4. [xlii] Calculations based on data from “World Prison Brief Database.” (http://www.prisonstudies.org/highest-to-lowest/prison_population_rate?field_region_taxonomy_tid=All) [xliii] https://www.pewtrusts.org/~/media/legacy/uploadedfiles/pcs_assets/2010/collateralcosts1pdf.pdf, 2. [xliv] https://www.pewtrusts.org/~/media/legacy/uploadedfiles/pcs_assets/2010/collateralcosts1pdf.pdf, 4. [xlv] As of 2015; Bridgewater analysis, based on data from the CDC (https://www.cdc.gov/nchs/data_access/VitalStatsOnline.htm#Mortality_Multiple) [xlvi] Chetty, Raj, et al., “The Association Between Income and Life Expectancy in the United States, 2001-2014”, Journal of the American Medical Association, 2016. [xlvii] As of 2015; Bridgewater analysis, based on data from the CDC (https://www.cdc.gov/nchs/data_access/VitalStatsOnline.htm#Mortality_Multiple) [xlviii] https://news.gallup.com/poll/4708/healthcare-system.aspx [xlix] https://ftp.cdc.gov/pub/Health_Statistics/NCHS/NHIS/SHS/2014_SHS_Table_A-11.pdf [L] https://www.americanprogress.org/issues/poverty/reports/2007/01/24/2450/the-economic-costs-of-poverty/' [LI] https://voteview.com/data
Ray Dalio. Raymond Dalio (born August 8, 1949) is an American billionaire investor, hedge fund manager, and philanthropist. Dalio is the founder of investment firm Bridgewater Associates, one of the world's largest hedge funds. As of January 2019, he is #79 of the world's 100 wealthiest people, according to Bloomberg.
|
Send this article to a friend:
 |
 |
 |

![[Most Recent Quotes from www.kitco.com]](http://www.kitconet.com/charts/metals/gold/t24_au_en_usoz_2.gif)
![[Most Recent USD from www.kitco.com]](http://www.weblinks247.com/indexes/idx24_usd_en_2.gif)
![[Most Recent Quotes from www.kitco.com]](http://www.kitconet.com/charts/metals/silver/t24_ag_en_usoz_2.gif)