
Send this article to a friend:
April
24
2019

|
Send this article to a friend: April |
|
Bankrupting Coffee Shops – Precious Metals Supply and Demand
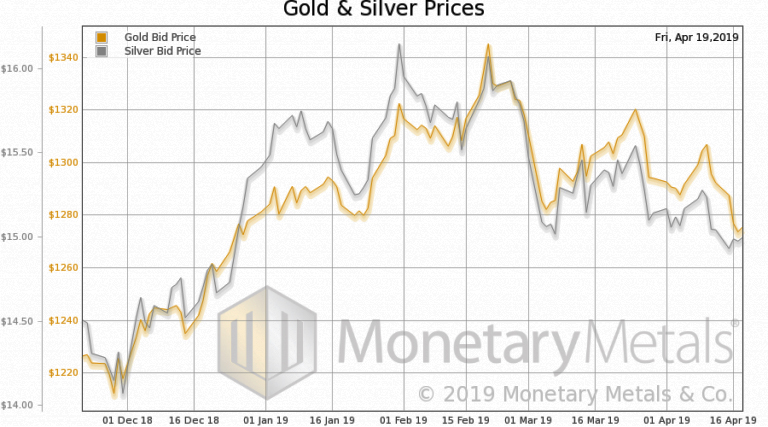
Last week was holiday-shorted due to Good Friday (it’s not an official holiday in the US, but it is in the UK. And this week’s report is a day late due to Easter Monday). The price of gold dropped $15, but the price of silver rose ¢4. Perhaps silver traders got word that we are paying interest on silver, which gives people a reason to hold silver? J The discussion in the opening essay [which can be found here, ed.] is germane to the topic of the gold price. It should be clear that—whatever its virtues—gold will not protect you from the second cause of rising prices (i.e., regulation that destroys productive businesses, and thus supply of goods, and hence causes prices to rise). The price of gold does not go up just because the city bankrupts another coffee shop. It is tempting to cling to the idea of the Quantity Theory of Money, the neoclassical notion that the price of moneyis inverse to its quantity. This sets the expectation of rapidly rising prices due to monetary policy. It is convenient to see rising prices due to the ever-increasing mandate to put useless ingredients in everything from coffee to the milk that goes in it. Mainstream economics has one word to refer to rising prices, due to either cause. Inflation. And this biases gold analysis. If inflation is affecting the price of coffee in Seattle, then why isn’t it affecting the price of gold? The answer is simple, now that we have two clear concepts. Inflation in this falling-interest rate cycle, is not monetary. Monetary forces are pushing prices down (due to falling interest rates). So if prices are rising, they are rising due to the increasing burden of useless ingredients. But all the gold ever mind in human history is still in human hands. No one has the power to add useless ingredients to gold. So the price of gold does not go up from this cause. This is one more reason why gold is the best way to measure declines in the dollar, and why the consumer price index fails. From the above discussion, we can see that coffee and milk are wholly inadequate measures. Fundamental Developments Anyway, let us look at the supply and demand picture of silver (and gold too). But, first, here is the chart of the prices of gold and silver.
Gold and silver priced in USD
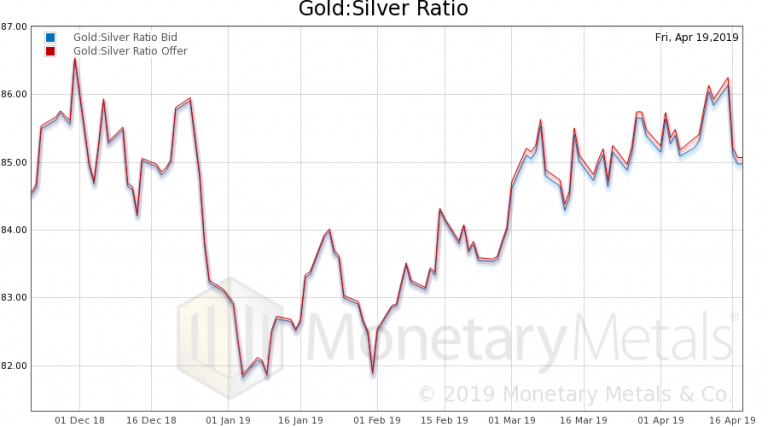
Next, this is a graph of the gold price measured in silver, otherwise known as the gold to silver ratio (see here for an explanation of bid and offer prices for the ratio). The ratio fell.
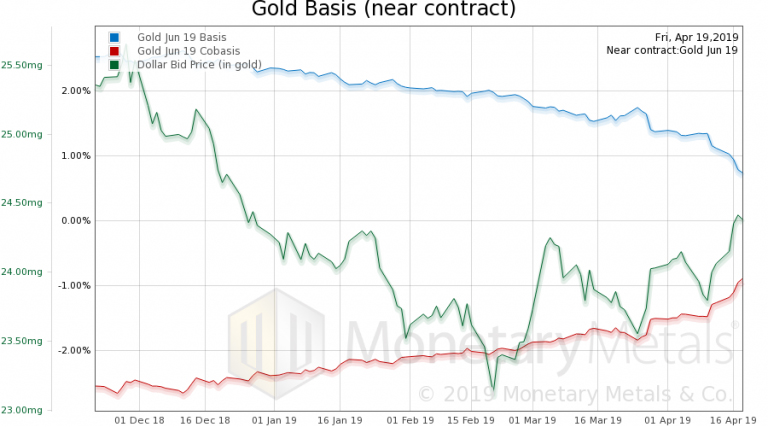
Gold-silver ratio Here is the gold graph showing gold basis, co-basis and the price of the dollar in terms of gold price.
Gold basis, co-basis and the USD priced in milligrams of gold The scarcity (i.e. co-basis) continues to rise, but not that much (especially the gold basis continuous). The Monetary Metals Gold Fundamental Price is down $33, to $1,426. Now let’s look at silver.
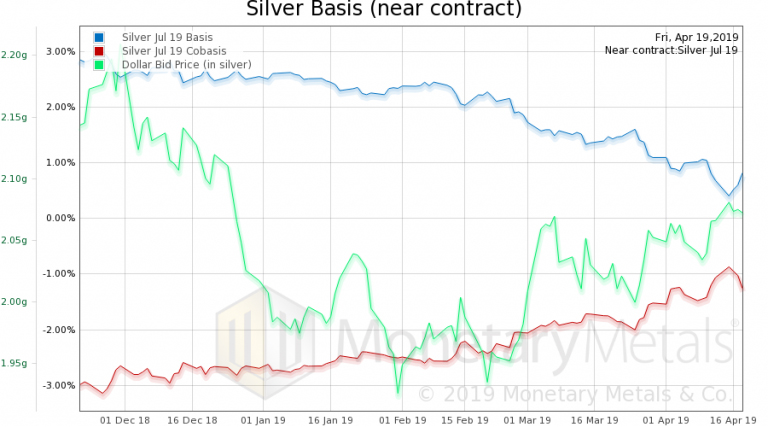
Silver basis, co-basis and the USD priced in grams of silver
The scarcity of silver (i.e., the co-basis) fell a bit. But the price did not change that much. The Monetary Metals Silver Fundamental Price was down another 25 cents to $15.84. © 2019 Monetary Metals Charts by: Monetary Metals Chart and image captions by PT
|
Send this article to a friend:
 |
 |
 |

![[Most Recent Quotes from www.kitco.com]](http://www.kitconet.com/charts/metals/gold/t24_au_en_usoz_2.gif)
![[Most Recent USD from www.kitco.com]](http://www.weblinks247.com/indexes/idx24_usd_en_2.gif)
![[Most Recent Quotes from www.kitco.com]](http://www.kitconet.com/charts/metals/silver/t24_ag_en_usoz_2.gif)