
Send this article to a friend:
March
03
2018

|
Send this article to a friend: March |
|
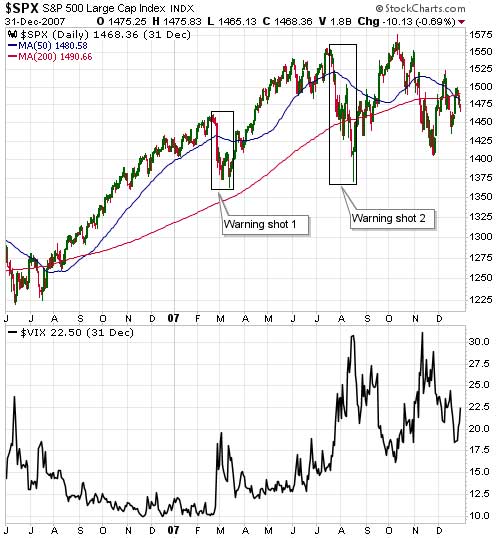
The warning shots of 2007
Assuming that the decline from the January-2018 peak is a short-term correction that will run its course before the end March (my assumption since the correction’s beginning in late-January), the recent price action probably is akin to what happened in February-March of 2007. In late-February of 2007 the SPX had been grinding its way upward in relentless fashion for many months. The VIX was near an all-time low and there was no sign in the price action that anything untoward was about to happen, even though some cracks had begun to appear in the mortgage-financing and real-estate bubbles. Then, out of the blue, there was a 5% plunge in the SPX. On the following daily chart this plunge is labeled “Warning shot 1″. After the February-March ‘hiccup’ the SPX resumed its bull market. Both the stock market and the economy were believed to be in good shape, with the problems that had emerged in the realm of sub-prime mortgage lending generally considered to be contained to that relatively-unimportant part of the economy. No less of an authority than Ben Bernanke assured us that these problems were, indeed, contained. The upward trend continued until mid-July, at which point another ‘out of the blue’ plunge began. This time the decline lasted 5 weeks and wiped 11% off the SPX. On the following daily chart it is labeled “Warning shot 2″. The July-August decline was taken more seriously by almost everyone, including the Fed’s senior management. It was taken seriously enough, in fact, to prompt a reversal in the Fed’s monetary policy. The Fed entered rate-cutting mode. During the weeks following the August-2007 low there was still widespread optimism. The overall economy was supposedly still strong, the Fed was being supportive and, as everyone knows, you should never fight the Fed. The SPX went on to make a marginal new high in October-2007 and then commenced a bear market that over the ensuing 17 months would result in a loss of almost 60%.
The SPX was more stretched to the upside in January of 2018 than it was in February of 2007 and the more recent plunge was twice as big, but we could be dealing with Warning Shot 1. Also, this time around there may not be a second warning shot.
|
Send this article to a friend:
 |
 |
 |


![[Most Recent Quotes from www.kitco.com]](http://www.kitconet.com/charts/metals/gold/t24_au_en_usoz_2.gif)
![[Most Recent USD from www.kitco.com]](http://www.weblinks247.com/indexes/idx24_usd_en_2.gif)
![[Most Recent Quotes from www.kitco.com]](http://www.kitconet.com/charts/metals/silver/t24_ag_en_usoz_2.gif)