
Send this article to a friend:
February
10
2022

|
Send this article to a friend: February |
|
1979 vs 2022: Why interest rate hikes are different
No doubt they will have lived a full life already, having seen huge political shifts like the fall of communism and the rise of China, witnessed the birth of the Internet and the explosion of e-commerce and social media, and lived through a series of public health crises including AIDS, SARS and COVID-19. One rather bizarre trend these 43-year-olds will have missed out on, was the hyperinflationary 1970s. Never have they lined up for gasoline, taken on a five-year mortgage financed at 11.25%, or purchased a Canada Savings Bond that promised to pay a whopping 12%. In 1979, then US Federal Reserve Chair Paul Volcker faced a serious challenge: how to quell inflation which had been wracking the economy for most of the decade. The prices of goods and services had averaged 3.2% annually since World War II, but after the 1973 oil shock, they more than doubled, to an annual 7.7%. Inflation reached 9.1% in 1975, the highest since 1947. Although prices declined the following year, by 1979 inflation had reached a startling 11.3% (led by the 1979 energy crisis) and in 1980 it soared to 13.5%
Not only was inflation going through the roof, but economic growth had stalled and unemployment was high, rising from 5.1% in January 1974 to 9% in May 1975. In this low-growth, hyperinflationary environment we had “stagflation”. Volcker is widely credited with curbing inflation, but in doing so, he is also criticized for causing the 1980-82 recession. The way he did it was the same as the current US Federal Reserve is telegraphing in their media messaging: raising the Federal Funds Rate. From an average 11.2% in 1979, Volcker and his board of governors through a series of rate hikes increased the FFR to 20% in June 1981. This led to a rise in the prime rate to 21.5%, which was the tipping point for the recession to follow. The early 1980s recession was actually two separate downturns, one that started in January 1980, dissipating to modest growth in July, and a deeper downturn that lasted from July 1981 to November 1982. The peak of the recession was in November and December 1982, when unemployment reached 10.8%, the highest since the Great Depression. Americans vented their anger at the central bank. As Wikipedia recounts, Volcker’s Federal Reserve board elicited the strongest political attacks and most widespread protests in the history of the Federal Reserve (unlike any protests experienced since 1922), due to the effects of high interest rates on the construction, farming, and industrial sectors, culminating in indebted farmers driving their tractors onto C Street NW Washington, D.C. and blockading the Eccles Building. US monetary policy eased in 1982, helping lead to a resumption of economic growth. Forty years later, the Federal Reserve faces a familiar foe, in rising and persistent inflation. And like Paul Volcker’s Fed, interest rate hikes are being touted as the solution to bringing it back in line. Debt constraints But there is one crucial difference between 1982 and 2022, and that is the debt. According to the FRED chart below, the US debt to GDP ratio was around 35%. Today it is more than three and a half times higher, at 128%. This severely limits how much and how quickly the Fed can raise interest rates, due to the amount of interest that the federal government will be forced to pay on its debt. 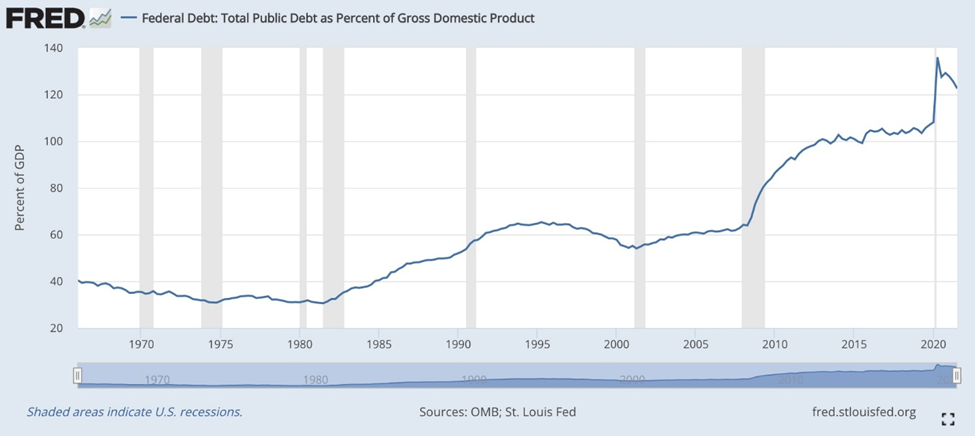 US debt to GDP ratio 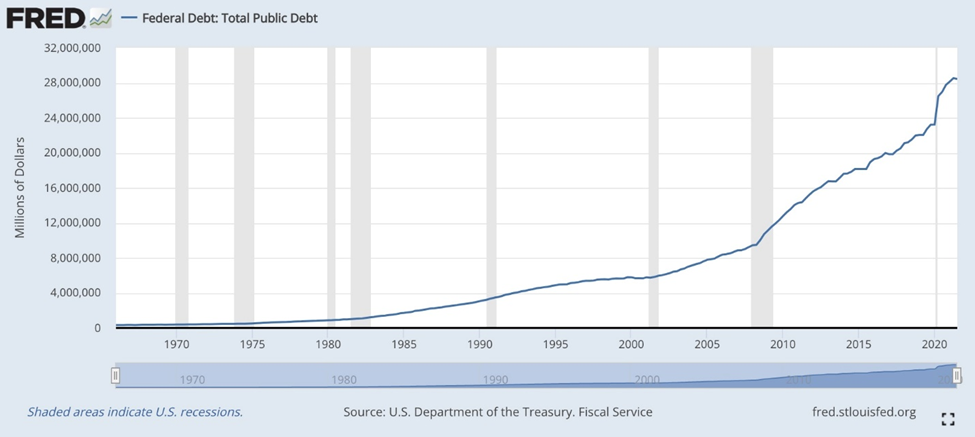 Total public debt The national debt has grown substantially under the watch of Presidents Obama and Trump. Under Obama’s two terms, the federal debt to GDP ratio rose from 43% in Q4 2008 to 75% in Q4 2016, an increase of 73%, states Investopedia. When Trump was handed the keys to the White House in January 2017, the national debt stood at nearly $20 trillion. When he left, in Q1 2021, it was at $28.1T. Since the end of 2019, the debt has surged about $7 trillion, with over half of that consisting of money borrowed to pay for covid-19 relief programs. (Congress has approved $4.6 trillion in total aid spending, according to Treasury Department data, with about $3.5T already spent, as of mid-December. That includes $844 billion in stimulus checks, $666B in unemployment compensation, $827B for the Paycheck Protection Program, $192B for health, and $60B for education) 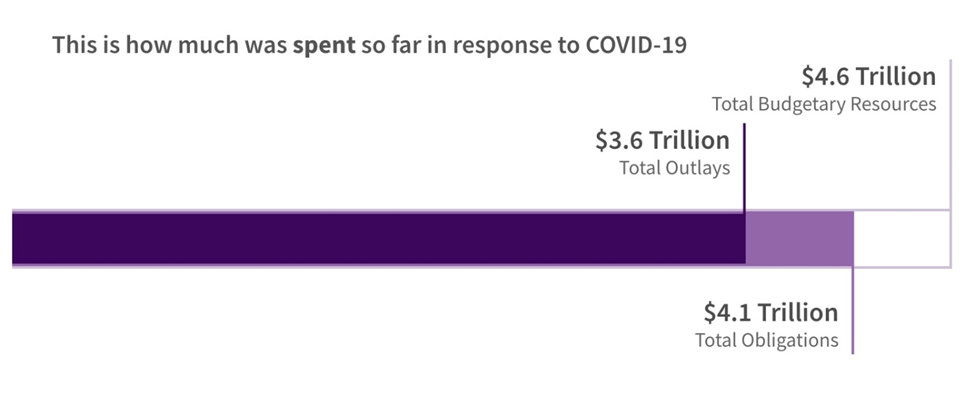 Source: USASpending.gov As of Oct. 20, 2021, the interest paid for the 2021 fiscal year (which ended on Sept. 30), was $562 billion. This is the accumulated monthly interest payments on US Treasury notes and bonds; foreign and domestic series certificates of indebtedness, notes and bonds; savings bonds; Government Account Series (GAS); State and Local Government Series (SLGs); and other special-purpose securities. $562B is what the government had to pay bondholders, on all the various debt instruments that were issued last year. Nearly $600 billion in interest was accumulated at interest rates close to 0%, and long-dated bond yields under 2%. But rates and yields are going up, and so will the interest payable to bondholders. The Fed is targeting at least three quarter-point interest rate hikes this year (3 X 0.25% = 0.75%). Each interest rate rise means the federal government must spend more on interest. That increase is reflected in the annual budget deficit, which keeps getting added to the national debt, now standing at a gob-smacking $30 trillion. 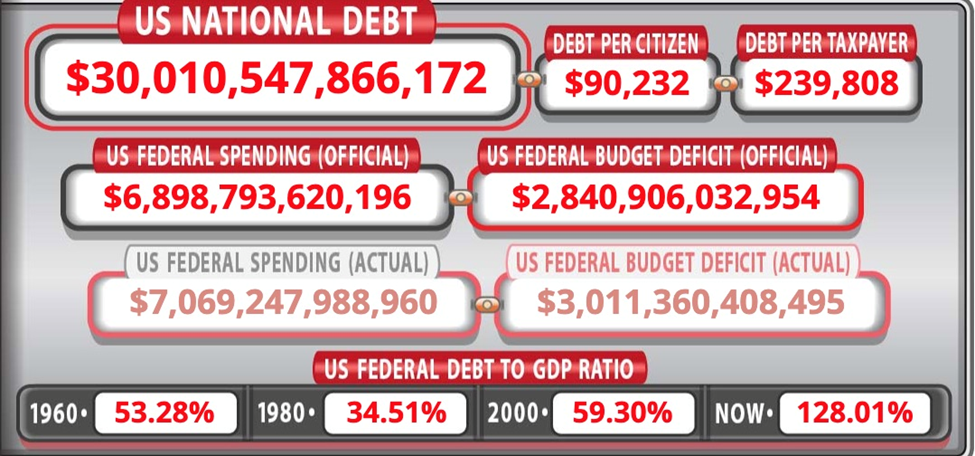 Source: US debtclock.org We are talking about interest costs approaching a trillion dollars per year, about a quarter of the $4 trillion in revenues the federal government took in last year. That’s insane. Higher debt servicing costs take away from other spending that that will have to be cut, as the government tries to keep its annual budget deficit under control. Whether the budget cuts are to health, education, transportation or veterans’ benefits, you or someone you know could be affected. The Congressional Budget Office (CBO) and the Committee for a Responsible Federal Budget (CRFB) — both reliable sources — project a deficit of $1.3T in 2022, and every year until 2031. This, plus the interest on the debt, severely constrains the Fed’s policy options. It needs to raise interest rates, to quell inflation, but going too far risks slamming the brakes on the economic recovery. The last thing it wants to happen is for the US consumer, who makes up 70% of annual gross domestic product, to quit spending. Yet that is precisely what could happen. Hostile Fed? Higher interest payments will not only add to the government’s budget deficit, they will be passed onto consumers and corporations, in higher mortgage rates, credit card interest payments, and corporate bond yields (companies unable to make payments on their loans could easily lay off workers to avoid going bankrupt. Or, they could raise their prices of goods and services to preserve profits). Yet the Fed is pressing on, hinting that more rate hikes are necessary, as its laser focus on inflation, and the supply chain crisis, intensifies.
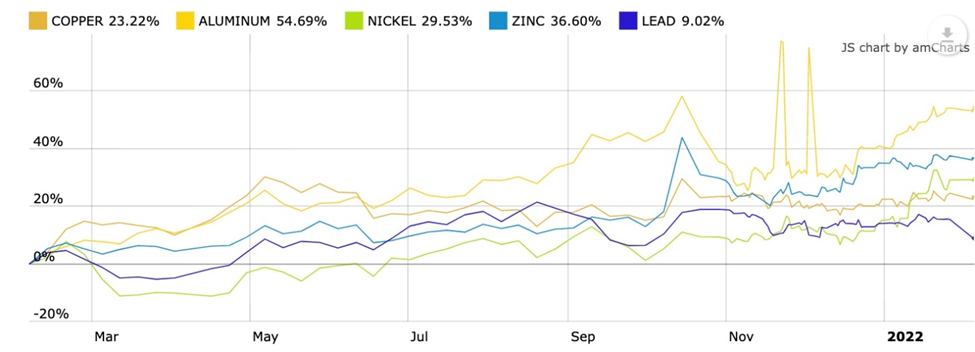
Powell’s hawkish stance at a press conference following the Fed’s January meeting sparked a sharp stock market sell-off. The pending withdrawal of liquidity saw the MSCI World Index — a measure of large- and mid-cap companies across 23 developed-country economies — fall 17%, Jan 1-29. On Thursday the technology-heavy Nasdaq index crashed 4%, in the worst rout since 2020, including a historic drop of Facebook’s parent company, Meta Platforms, that wiped out more than $250 billion in market value. A Fox Business News story this week said the Fed is now contemplating seven interest rate hikes of a quarter percentage points, corresponding to each Federal Open Market Committee (FOMC) meetings this year. That would bring the target range to between 2.75% and 3%, by year’s end. Can the economy handle that kind of a hike? A more recent example of what happened when a hostile Fed tried a significant interest rate hike, was in 2018. To wean the economy off of ultra-low interest rates, in 2015 the Fed increased the Federal Funds Rate a quarter percentage point, from 0.25 to 0.5% (the same as the Fed is contemplating now). In a series of subsequent raises, the Fed tightened from 0.5% in December 2015 to 2.5% in December 2018. We all remember what happened to the economy. For three months the stock market plunged nearly 20%, before Powell relented, and began loosening again. A series of rate cuts saw the Federal Funds Rate fall from 2.25% on July 31, 2019 to 0.25% on March 15, 2020, which is where it remains. 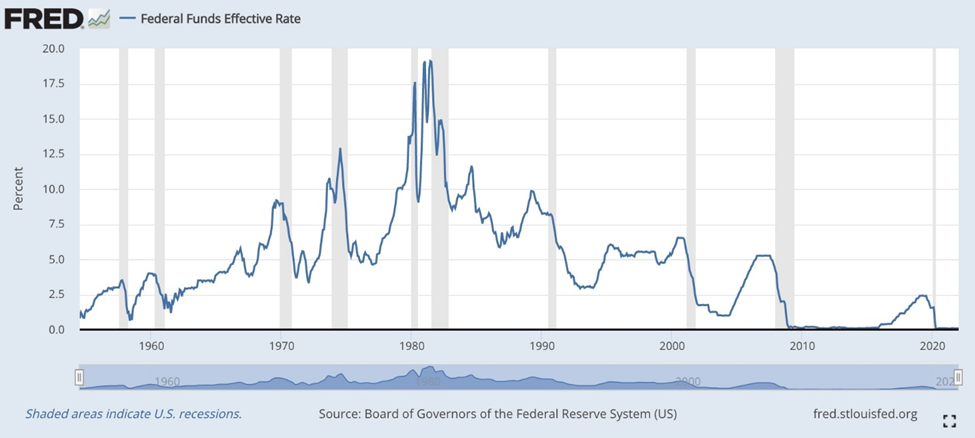 Federal Funds Rate (On Feb. 5, 2018, the Dow Jones Industrial Average plunged 1,600 points, which at the time was a record one-day drop. It was broken by the 2020 market crash which saw the Dow fall 2,997 points. On December 19, 2018, following the Fed’s fourth interest rate hike, all three US stock indexes hit intra-day lows for the year) Surely the Fed knows the history. If it decides to aggressively attack inflation, “going hostile” with rate hikes greater than 2% in 2018, which crashed the stock market, it risks killing the economy again, bankrupting businesses and worst of all, throwing the US consumer to the wolves, to deal with a double-whammy of higher interest payments on mortgages and other loans, plus credit card interest rates north of 20%; and inflation close to 10%, the worst in four decades. Inflation approaching 10% It’s important to understand that the US Federal Reserve’s concept of inflation is different from both the official statistic and the reality in the economy. The Consumer Price Index (CPI) is currently 7%, which is the highest since 1982 — a 40-year high. This is the number most quoted in the financial press; it is the official inflation rate. Real “on the ground” inflation is much higher. CPI’s less known but more accurate cousin is the Producer Prices Index (PPI). Unlike CPI, which is crafted by bean counters, the PPI is based on information from actual producers of goods and services. The numbers don’t lie. The latest PPI data point clocked in at 9.7% for 2021 — close to double-digit inflation, the biggest calendar-year increase since data was first calculated in 2010. It must also be pointed out that the government does not calculate inflation like it used to. John Williams’ Shadow Government Statistics published two charts, one showing inflation today if it was calculated the same way it was in 1990, the second showing inflation today using 1980’s methodology. The latter reveals the actual inflation rate today is 15%, not 7%. The historic price increases are mostly due to strong demand for goods and services exceeding available supplies in an economy still hampered by coronavirus pandemic restrictions. However, those hoping supply-chain disruptions will soon be ironed out and inflation heads back down, will be disappointed. Higher prices will, imo, stay with us for a long time due to persistent food inflation, wage/ salary increases due to a shortage of workers, a ragged energy transition from fossil fuels to renewables that has led to record-high natural gas prices, and climate change which has a negative effect on crops, meaning higher prices for agricultural commodities. 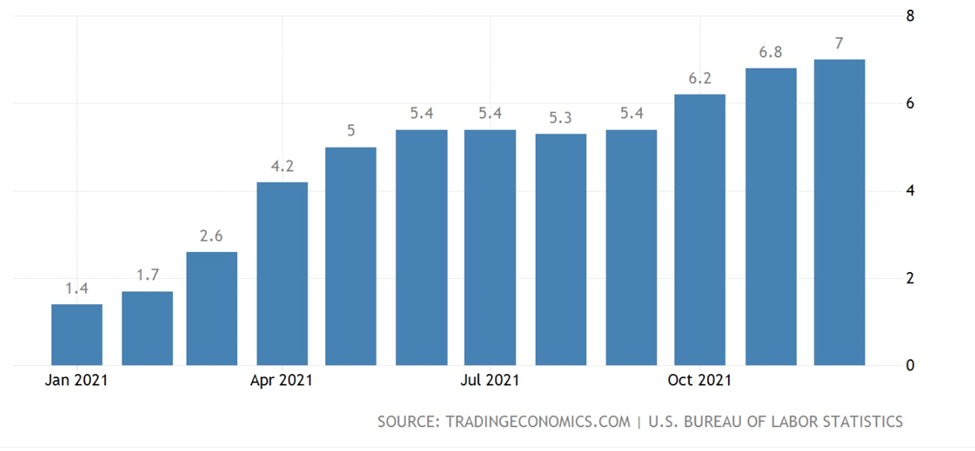 US inflation rate (CPI) 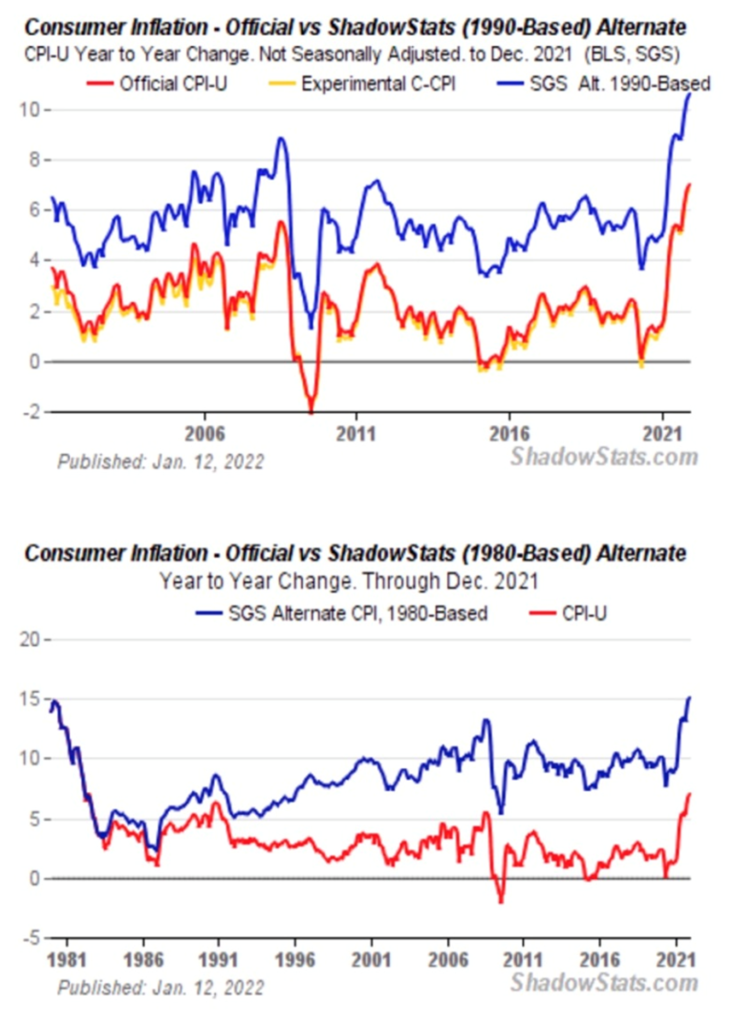 Inflation is most prevalent in food and energy/ transportation — the very two areas that the Fed’s often-quoted “core PCE” inflation stat ignores. A story this week in the New York Times cites data from the United Nations showing global food prices in January hit their highest level since 2010. Between April 2020 and December 2021, the price of soybeans climbed 52%, and corn and wheat both grew 80%. Coffee prices increased 70% due mostly to droughts and frost in Brazil. Food prices in the United States rose 6.3% in December, year on year, with the prices of meat, poultry, fish and eggs all jumping 12.5%, according to the Bureau of Labor Statistics. The BLS calculated that energy prices were a whopping 1,009% higher in 2021 compared to 1957. Between these years, energy inflation averaged 3.83% per annum. Energy costing $20 in the 1957 would cost $221.98 in 2021 for an equivalent purchase. Last year in the UK, energy costs were up over 30%. The Independent reports that millions of UK households will see their gas and electricity bills jump by more than 50% in April, meaning a £693 per year increase for the average customer. In Europe, natural gas prices have hit records due to coal plants being shut down as well as nuclear plants shelved, such as in Germany and France. The skyrocketing cost of electricity is being borne by ordinary citizens who had no part in this dumb policy of “premature decarbonization”. Natural gas prices have also risen in the United States, though not to the same extent as Europe, as has gasoline. 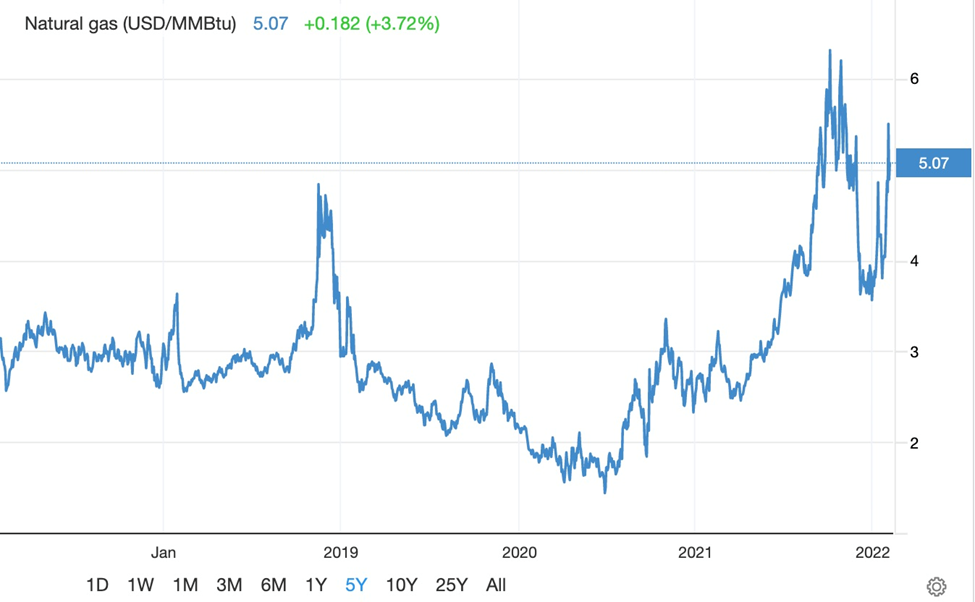 US natural gas prices. Source: Trading Economics 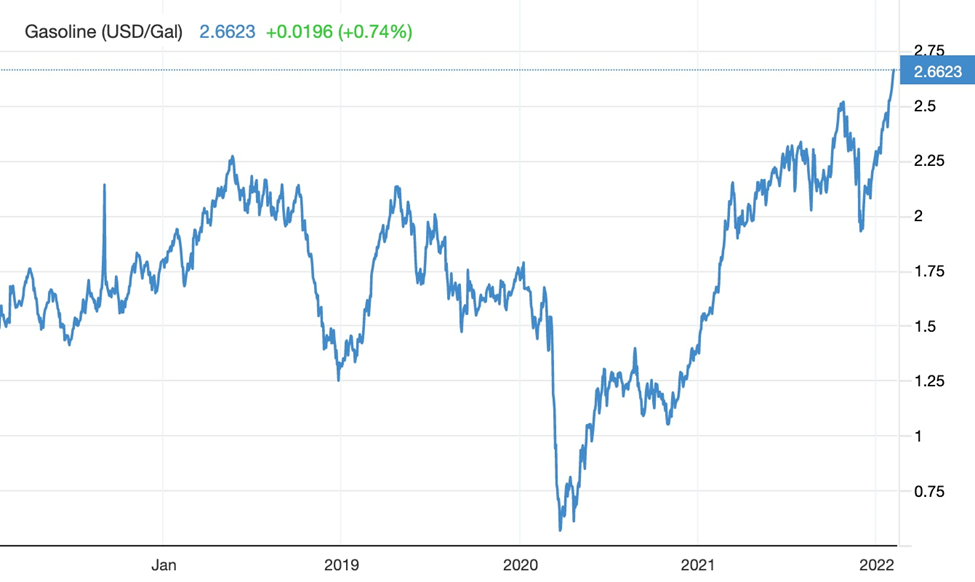 US gasoline prices. Source: Trading Economics Along with more expensive agricultural goods, food and fuel, inflation is being seen in higher metals prices. For example copper, zinc, lead, nickel and aluminum, have all done quite well, over the past year.
Source: Kitco A green infrastructure and transportation spending push will mean a lot more metals will need to be mined, including lithium, nickel, and graphite for EV batteries; copper for electric vehicle wiring and renewable energy projects; silver for solar panels; rare earths for permanent magnets that go into EV motors and wind turbines; and silver/ tin for the hundreds of millions of solder points necessary in making the new electrified economy a reality. In fact, battery/ energy metals demand is moving at such a break-neck speed, that supply will be extremely challenged to keep up. Without a major push by producers and junior miners to find and develop new mineral deposits, glaring supply deficits are going to beset the industry for some time. Conclusion We have actual, on-the-ground inflation approaching 10%, the same as it was in 1979, when the Paul Volcker Fed started aggressively hiking interest rates, eventually doubling the Federal Funds Rate to 20%. The rate increases managed to curb inflation but the economy paid a terrible price. For two years, it was mired in recession, as growth stalled and unemployment hit double digits. When the Great Recession began in 2007, the Fed had learnt its lesson from being overly hawkish in responding to an ailing economy. Instead the Fed tried a then-radical new policy called quantitative easing. Cutting interest rates back to zero and buying up US Treasuries and mortgage-backed securities injected much-needed liquidity into the economy. Disaster was averted, the stock market thrived and economic growth eventually normalized. However the degree to which the economy, and especially the stock markets, had become addicted to “the punch bowl” of easy money, became apparent when the Fed tried to back off on QE and raised interest rates. This “quantitative tightening” only went as far as a 2% rate hike before the stock markets revolted in 2018, prompting the Fed to reverse course and go back to lowering rates. Now let’s remember the debt. Look at the damage the Fed did to the economy in doubling interest rates, when the debt to GDP ratio was only 35%. Either the Fed thought the government could handle the higher interest payments on the debt, or it didn’t care, its only concern being to beat inflation. We saw history repeating itself in 2018. Four interest rate hikes saw US stock market indexes in free-fall near the end of the year. The Fed could only tighten a total of 2% before the economy crashed. The debt to GDP ratio in 2018 was 105%. The situation the Fed currently finds itself is even worse. Now we have inflation approaching 10%, but the debt to GDP is at 128%. (The official debt figure is $30 trillion, but when unfunded liabilities are counted, it’s more than four times higher) If the Fed is serious about fighting inflation, and let’s go with the more conservative 7% CPI figure, it should really hike rates at least half of that, say +3.5%. But doing that will significantly increase debt servicing payments, already nearing $600 billion. At a projected annual deficit of $1.3 trillion, by 2032 we could be looking at a national debt of $43 trillion. That would push interest payments on the debt well past $1 trillion, we believe, equivalent to one-quarter of annual US government revenues. It will also hurt businesses, who are already maxed out on loans due to COVID-19 restrictions. How will they handle a 3.5% monthly increase to their payments? Mortgage rates, car loans, and credit card payments will all go up. As usual the heaviest burden will be borne by the poor and the working poor, who use their credit cards to make up for budget shortfalls, financed at a usurious >20%. Can the Fed really afford to slam the consumer, which makes up 70% of the economy, with these dramatic rate hikes? Ironically, the Fed’s cure for high inflation may prove to be worse than the disease. If consumers stop spending, due to higher interest rates and persistent inflation, businesses confidence will plummet, mass layoffs will occur, growth will stop, just like it did in 1980, and the US will enter a recession. The Fed must therefore be very careful in what it decides. The room for error is tiny and the consequences of a wrong decision will be disastrous. Richard (Rick) Mills Legal Notice / Disclaimer Ahead of the Herd newsletter, aheadoftheherd.com, hereafter known as AOTH. Please read the entire Disclaimer carefully before you use this website or read the newsletter. If you do not agree to all the AOTH/Richard Mills Disclaimer, do not access/read this website/newsletter/article, or any of its pages. By reading/using this AOTH/Richard Mills website/newsletter/article, and whether you actually read this Disclaimer, you are deemed to have accepted it. Any AOTH/Richard Mills document is not, and should not be, construed as an offer to sell or the solicitation of an offer to purchase or subscribe for any investment. AOTH/Richard Mills has based this document on information obtained from sources he believes to be reliable, but which has not been independently verified. AOTH/Richard Mills makes no guarantee, representation or warranty and accepts no responsibility or liability as to its accuracy or completeness. Expressions of opinion are those of AOTH/Richard Mills only and are subject to change without notice. AOTH/Richard Mills assumes no warranty, liability or guarantee for the current relevance, correctness or completeness of any information provided within this Report and will not be held liable for the consequence of reliance upon any opinion or statement contained herein or any omission. Furthermore, AOTH/Richard Mills assumes no liability for any direct or indirect loss or damage for lost profit, which you may incur as a result of the use and existence of the information provided within this AOTH/Richard Mills Report. You agree that by reading AOTH/Richard Mills articles, you are acting at your OWN RISK. In no event should AOTH/Richard Mills liable for any direct or indirect trading losses caused by any information contained in AOTH/Richard Mills articles. Information in AOTH/Richard Mills articles is not an offer to sell or a solicitation of an offer to buy any security. AOTH/Richard Mills is not suggesting the transacting of any financial instruments. Our publications are not a recommendation to buy or sell a security – no information posted on this site is to be considered investment advice or a recommendation to do anything involving finance or money aside from performing your own due diligence and consulting with your personal registered broker/financial advisor. AOTH/Richard Mills recommends that before investing in any securities, you consult with a professional financial planner or advisor, and that you should conduct a complete and independent investigation before investing in any security after prudent consideration of all pertinent risks. Ahead of the Herd is not a registered broker, dealer, analyst, or advisor. We hold no investment licenses and may not sell, offer to sell, or offer to buy any security. .
Richard Mills is a mining expert, financial writer, and the owner of Aheadoftheherd.com. He invests in the junior resource/bio-tech sectors and his articles have been published on over 400 websites, including: WallStreetJournal, SafeHaven, MarketOracle, USAToday, NationalPost, Stockhouse, Lewrockwell, Pinnacledigest, UraniumMiner, SeekingAlpha, MontrealGazette, CaseyResearch, 24hgold, VancouverSun, CBSnews, SilverBearCafe, Infomine, HuffingtonPost, Mineweb, 321Gold, Kitco, Gold-Eagle, The Gold/Energy Reports, CalgaryHerald, ResourceInvestor, Mining.com, Forbes, FNArena, Uraniumseek, FinancialSense, Goldseek, Dallasnews, Vantagewire, Resourceclips and the Association of Mining Analysts.
|
Send this article to a friend:
 |
 |
 |
 Someone born in 1979 is 43 years old this year.

![[Most Recent Quotes from www.kitco.com]](http://www.kitconet.com/images/live/s_gold.gif)
![[Most Recent USD from www.kitco.com]](http://www.weblinks247.com/indexes/idx24_usd_en_2.gif)
![[Most Recent Quotes from www.kitco.com]](http://www.kitconet.com/images/live/s_silv.gif)