
Send this article to a friend:
February
08
2016

|
Send this article to a friend: February |
|
INDICATORS SHOW: Collapse Of The Paper Gold & Silver Market May Be Close At Hand
We must remember, a collapse does not happen overnight, but the endgame does. This can be clearly seen in the collapse of the Roman Monetary System:
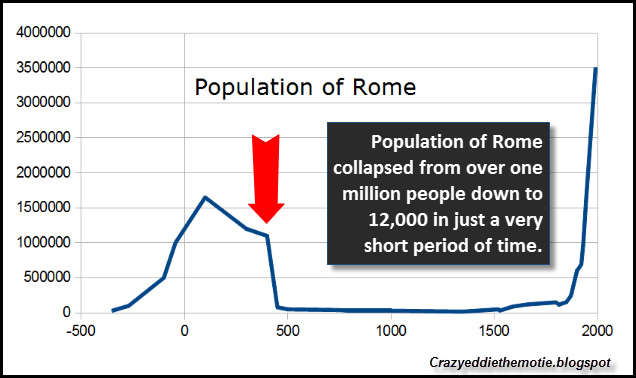
As we can see from the chart above, the devaluation of the Roman coin, the Silver Denarius, started slowly about 50 AD. This continued until the silver value of the Denarius plummeted in 241. This had a profound impact on the population of Rome, shown in the chart below:
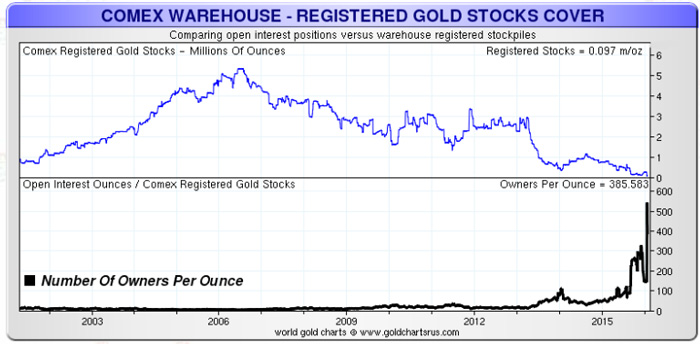
You will notice the population of Rome peaked at approximately 1.6 million people about 100 AD, started to slowly decline, and fell off a cliff at the end of the 5th century. The population of Rome fell from over one million people to 12,000 in a very short period of time. Thus, the collapse of the Roman Monetary System paralleled the disintegration of Rome itself. What took place in Ancient Rome, is also taking place in our global modern high-tech world. When Nixon dropped the convertibility of the U.S. Dollar into gold in 1971, a few years later… the gold futures markets started trading. No longer was the world’s reserve currency backed by gold, instead the Dollar was valued against the gold price traded on the futures exchanges. Number Of Owners Per Ounce Of Registered Gold Goes Exponential Again, to have a properly functioning futures exchange, there has to be available supply of metal. However, if we look at the long-term trend of Registered Gold inventories at the Comex, something looks painfully wrong here:
The chart shows the total amount of Registered Gold inventories on the top and the number of owners per ounce on the bottom. From 2001 to 2013, the number of owners per ounce of gold trend line was basically flat.. except for a few blips. But, something changed in 2013 when the price of gold was taken down from $1,600 to $1,150 in a short period of time. As the amount of Registered Gold declined, the number of owners per ounce shot up over 100 by the beginning of 2014. Then the trend line fell and remained flat until the middle of 2015… when all hell broke loose. This was at the time there was a threat of a Greek Exit of the European Union and concern that the broader markets may crash by the end of the year. The owners per ounce of gold shut up to over 500 when the Registered Gold inventories declined to only 74,000 oz recently. Since then, there have been some small deposits of gold into the Registered Category and the current owners per ounce is about 250. Craig at TFmetals Report wrote a good piece describing what may of happened when 73% of Registered Gold inventories plummeted in one day in his article, Connecting The Comex Dots:
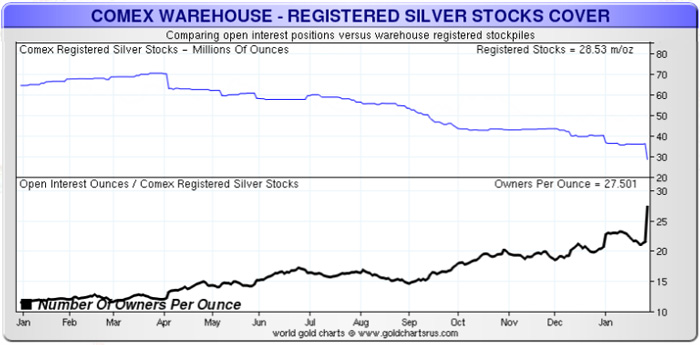
Regardless, if we look at the owners per ounce of gold via the Registered Category, we can see how the trend line has gone exponential. Anything that heads into an exponential trend, doesn’t last for long. This was also true in the Roman Monetary System chart shown above. Now, what has taken place in the Comex Registered Gold Market, seems to be bleeding over into the silver market. Comex Registered Silver Owners Per Ounce… Getting Ready To Parallel Gold’s Trend? According to the data from Sharelynx.com, the Comex Registered Silver inventories and number of owners per ounce are heading in the same trajectory as gold. If we look at the one year chart, the number of owners per ounce of Registered Silver was approximately five in January 2014.
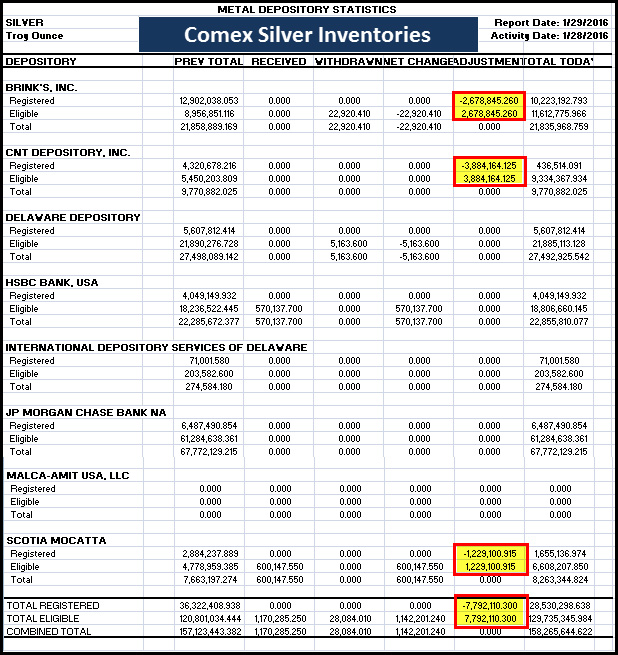
However, this steadily increased over the year and jumped to 27 owners per ounce when nearly eight million oz of Registered Silver was transferred to the Eligible Category on January 28th:
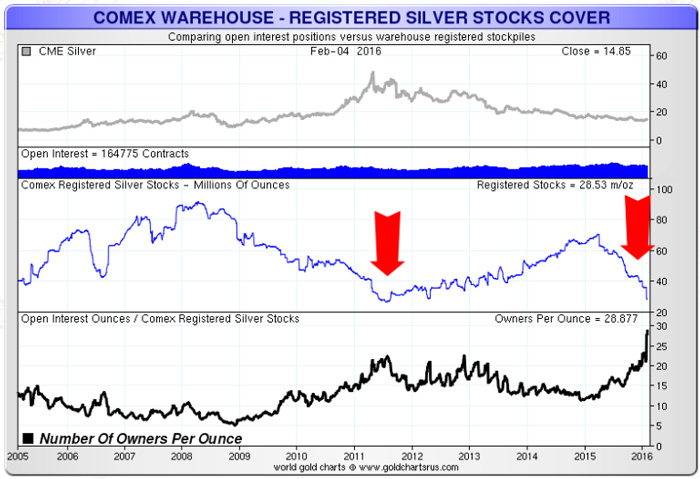
The largest transfer of Registered Silver was from the CNT Depository of 3.9 million oz (Moz). What is interesting about the CNT Depository is that it now only holds 436,500 oz in its Registered Inventories when it had nearly 30 Moz back in April 2015. Furthermore, if we look at the long-term Comex Registered Silver inventories we can see some interesting divergent trends:
Before the collapse of the U.S. Investment Banking Industry and Housing Market in 2009, the owners per silver ounce declined from above 10 in 2005 to five in 2009. Then as the Registered Silver inventories declined from a high of 90 Moz in 2008 to a low of 26 Moz in 2011, the owners per ounce increased to over 20. As we can see, Registered Silver inventories began to build after the price of silver hit a record $49 in May 2011 and peaked at 70 Moz at the beginning of April 2015. Then as concern in the stability of the Global and U.S. Markets increased in the summer, record physical silver investment demand pushed wait times for retail products upwards of two months. Thus, the drain of Registered Silver inventories began in earnest. Now the number of owners per ounce of Registered (Deliverable) is heading towards the 30 figure. While this number isn’t as significant as the Registered Gold’s figure of 250… it has never been this high in more than ten years. Moreover, there is a divergent trend taking place. When the owners per ounce of Registered Silver went above 20 in 2011, it was due to increased industrial and investment demand as traders feared that the price would continue higher. In contrast, the new record 27 owners per ounce has occurred when the price of silver is now trading 70% lower than its 2011 peak with falling industrial demand. So, something just isn’t right in the paper gold and silver markets. I believe these charts are indicators that the coming collapse of the paper precious metals markets is close at hand. I am not saying it will happen today, next month or this year… but the trends are heading in an exponential fashion. Again… all exponential trends end in collapse… BAR NONE. My fear is the collapse of the paper gold and silver futures markets may usher in a NEW DARK AGE. There is plenty of rumor and conspiracy on the alternative internet that the powers that be are certainly planning something to cover up the disintegration of the U.S. Dollar Fiat Monetary System. In all likelihood, the coming collapse of the economic and financial system will happen virtually overnight. Unfortunately, investors who are still playing Russian Roulette in the broader markets may find out sooner than later, TIMING AN EXIT is folly. Owning physical gold and silver out of the banking system is the best alternative to the madness that is coming. Please check back for new articles and updates at the SRSrocco Report. You can also follow us at Twitter below:
Steve considers studying the impacts of EROI one of the most important aspects of his energy research. For the past several years, he has written scholarly articles in some of the top precious metals and financial websites. You can find many of Steve’s articles on noteworthy sites, such as GoldSeek-SilverSeek, Market Oracle, Financial Sense, GoldSilver.com, SilverDoctors, TFMetals Report, Outsiderclub, SGTreport, BrotherJohnF, Hartgeld, Der-klare-blick, PeakProsperity, SilverStrategies, DollarCollapse, FurtureMoneyTrends, Sharpspixley, FinancialSurvialNetwork, Pmbull, Deviantinvestor, PmBug, Wealthwire, and ZeroHedge.
|
|---|
Send this article to a friend:
 |
 |
 |
 There is something seriously wrong taking place in the markets today. This is also true in the paper gold and silver markets as well. For a paper precious metals futures market to function properly, there has to be ample supplies of physical metal. However, the ongoing trend of falling precious metal inventories points to big trouble in the paper gold and silver markets.
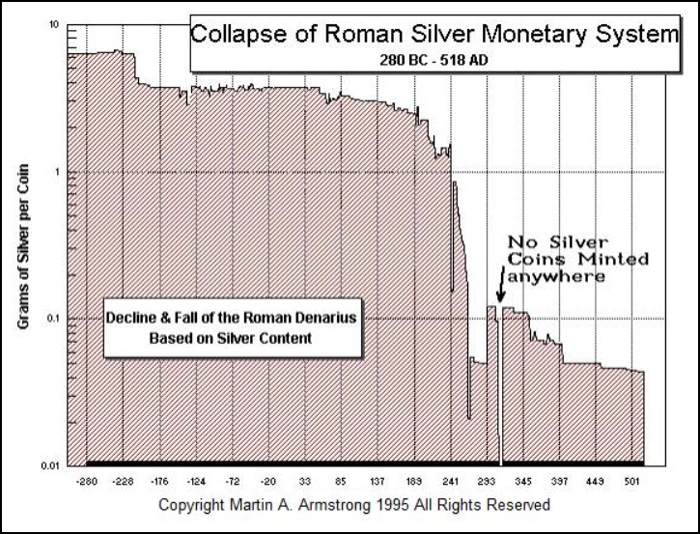
 Independent researcher Steve St. Angelo (SRSrocco) started to invest in precious metals in 2002. Later on in 2008, he began researching areas of the gold and silver market that, curiously, the majority of the precious metal analyst community have left unexplored. These areas include how energy and the falling EROI – Energy Returned On Invested – stand to impact the mining industry, precious metals, paper assets, and the overall economy.