Kill The Middle Class, Kill The Nation
Raúl Ilargi Meijer
 A pretty simple and straight continuation from yesterday’s Inequality Leads to War and Crisis , if only to hammer into everyone’s head that inequality is a very damaging development, and a very easy one to solve. America as it was in its heyday was built by the middle class, and that America is no more. A pretty simple and straight continuation from yesterday’s Inequality Leads to War and Crisis , if only to hammer into everyone’s head that inequality is a very damaging development, and a very easy one to solve. America as it was in its heyday was built by the middle class, and that America is no more.
Still, if you didn’t know better, you’d get the impression that America was built by the rich. Why otherwise would its wealth have been allowed to be shifted away from the middle class, and to the rich, to the extent that it has over the past 3 or 4 decades?
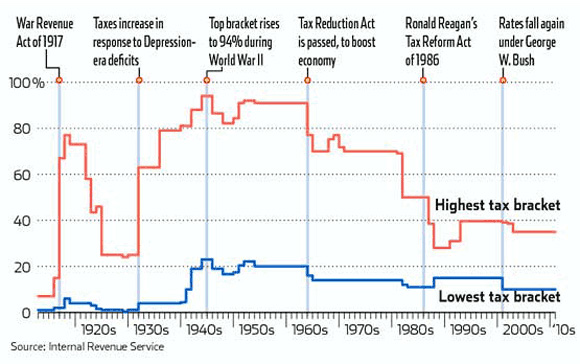
The disastrous consequences for American society should have been plain for everyone to see. America’s heyday started off in the 50s with a 90% highest income tax bracket, which was lowered to 70% in 1960 through the Tax Reduction Act. Today it is 35%, and today is anything but a heyday.
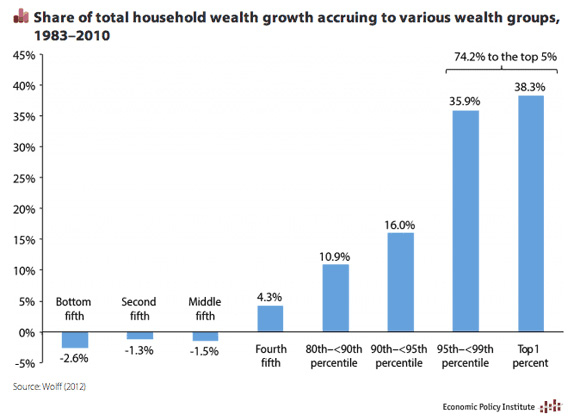
According to Charles R. Morris, author of “The Trillion Dollar Meltdown: Easy Money, High Rollers and the Great Credit Crash”, the additional share of personal income of the top 1% , which went from 8.9% in 1975 to 22.5% today, is worth $1.6 trillion. Per year. And that’s just the top 1%. Add the additional share of the top 10%, and it’s a lot less difficult to see the sinkhole the middle class is disappearing into.
When inequality becomes so extreme that it induces poverty at the bottom, it kills societies. Or, to put it differently, where inequality is concerned, America is becoming a third world country. But it’s not going to be a smooth sailing transition. So far, people have been surprisingly docile, spurred on be endless stories of desolate street corners around which recovery beckons, but when markets go south and once again more cuts are announced alongside higher bonuses for bankers, something will obviously have to give.
There is no need for this to happen. There is no need to think that today’s tax levels are “normal”. History flatly denies any such notion. And it has nothing to do with the government handing out money to people. All it takes to reverse the present perverse trend is to bring taxes (income, capital gains) back to levels that history shows are most beneficial to society as a whole, and use the proceeds to pay people better wages, living wages. That would stimulate the economy much more forcefully than anything Washington or the Fed hand out.
That doesn’t mean we will see the same growth rates again that we did in for instance the 1960s, we’re too far into resource depletion and environmental destruction for that. But we can still establish a much more prosperous society than the one we see on the horizon today.
More details here from a piece former banker and lawyer Charles R. Morris published at Reuters. Proof, meet pudding.
The Middle Class's Missing $1.6 Trillion
The United States was the world's first middle-class nation, which was a big factor in its rapid growth. Mid-19th-century British travelers marveled at American workers' "ductility of mind and the readiness…for a new thing" and admired how hard and willingly they labored. Abraham Lincoln attributed it the knowledge that "humblest man [had] an equal chance to get rich with everyone else."
Most Americans still think of themselves as middle class. But the marketing experts at the big consumer goods companies are giving their bosses the unsentimental advice that the middle class is an endangered species. Restaurants, appliance makers, grocery chains, hotels are learning that they either have to go completely up-scale, or focus on bargains for the struggling and budget-conscious. [..]
For the last 15 years, an international consortium of economists has been building data bases on the income shares of the richest people in the developed countries, based on pre-tax market income including capital gains and tax-exempt income, and excluding government transfers. The American data reveals the greatest inequality by far, followed by Great Britain.
The stunning income distribution has a remarkable symmetry. In 2012, the top 10% captured half of all reported income. But the top 1% got almost half of that — 22.5% — while the top 10th of 1% (0.1%) captured half of that. All three are within a few decimal places of the previous highs — which occurred in 1928, just before the market crash that ushered in the Great Depression.
The stock market implosion of the 1930s followed by World War II's strict price controls and high marginal taxes brought the top 1%'s income share down to about 9% by the end of the war. Executive and financial sector pay was quite restrained, even through the good times of the 1950s and 1960s, and the 1%'s income share did not start to rise until the late 1970s. It took off for the stratosphere then — amid the oceans of cash sloshing around Wall Street during the 1980s leveraged buyout boom.
[..] The difference between the 1%'s income share in 1975 (8.9%) and today's 22.5% is 13.6%. That additional share of personal income is worth $1.6 trillion. Each year. To amass that incremental $1.6 trillion, the 1% took 68% of all personal income growth between 1993 and 2012. [..] … during the recovery of 2009-2012, they took a whopping 95% of the income growth …
The canonical retort to such musings is that all segments of society benefit from a well-fed and contented super-rich. Unfortunately, that is not proved true in recent experience. Since financial markets were liberalized in the 1980s, the finance sector's income and debt has soared, income inequality has skyrocketed, and the world economy has flopped from crisis to crisis – the Savings and Loan fiasco, the petrodollar debacle, and the leveraged buyout circuses of the 1980s; the "hot-money" driven currency crises and hedge-fund collapses of the 1990s, and the hallucinatory mortgage games of the 2000s.
Adair Turner, the former head of the British financial regulatory authority, has outlined the "complexification" of finance that gave rise to the insane derivative structures and synthetic portfolios that unraveled so dramatically in 2008. Stephen Cecchetti and Enisse Kharroubi, two senior economists at the Bank for International Settlements, have documented the "inverse U-shaped curve" of finance's contribution to the economy.
The history of all developed countries shows that as finance employment rises, economic growth and productivity increases. But only up to a point. After that, continued growth of the finance sector often triggers falling growth and declining productivity.
The two authors also worked out a model of why this happens. As the financial sector grows more sophisticated, it competes with technology and manufacturing industries for the smartest and most ingenious engineers and mathematicians. At the same time, however, broad-gaged finance needs highly "pledgeable" assets that can be readily leveraged, like residential and commercial mortgages. (High-technology investing has a very high risk of failure, and so is the preserve of specialist venture-capital firms.)
The best and the brightest, they found, instead of creating new technology breakthroughs, become the servants of the super-rich — because they pay the most. The engineers devote themselves to increasing low-productivity, easily understandable assets in order to transmute them into new, highly complex, instruments that look super-safe, but often aren't. How to wreck an economy in three easy steps.
[..] … a key founder of the "University of Chicago School" of free-market economists, Henry Simon, opposed almost all government regulation, except for the financial sector. Simon understood that very smart people applying high leverage to other people's money is an invitation to disaster, and so required tight regulation.
The most important step today might be breaking up the mega-banks that emerged from the crash. Then they would be easier to police — and easier to indict.
Second should be to start rolling back the income shares of the very richest people by targeted taxation and other strategies, including radical tax simplification to reduce the legal cubbyholes for sheltering income. The economist Brad DeLong wonders why the middle classes haven't risen up and demanded fairer income distribution.
Reducing the top 1%'s income share to, say, 14 or 15%, still much higher than the pre-1980 norm, would free up about $1 trillion for middle-class tax relief; higher minimum wages; pension, healthcare, and educational subsidies, or job-creating infrastructure construction.
The U.S. consumer may have had enough (MarketWatch)
Disposable Income: At the end of January, the Department of Commerce's Bureau of Economic Analysis reported that disposable income was unchanged in December after a meager 0.1% rise in November and a 0.2% decline in October. Hardly encouraging momentum.
Retail sales: This week, we learned U.S. retail sales fell at a 0.4% seasonally adjusted rate in January. Even more disappointing is that December's previously reported gain was revised down to a 0.1% decline. Excluding autos the numbers were slightly better, but still disappointing.
Jobs: About those retail sales: Challenger, Gray & Christmas reported that planned layoffs are on the rise thanks to weak spending over the holidays that hasn't reversed. And given two massively disappointing jobs reports for January and previously for December, that doesn't bode well for hiring trends going forward.
Food stamp cuts: Adding fuel to the fire is the recent passage of a over $8 billion in cuts to food stamps as part of the recent Farm Bill passed by Congress on the heels of a $5 billion cut that hit in November of 2013. Say what you want about big government, but the math is simple — smaller benefits mean less money in the pockets of recipients, and less spending as a result.
The Chart That Really Has The Fed Worried (Zero Hedge)
While complaining (just this morning once again) that it’s fiscal policy that is dragging growth, we suspect The Fed knows full well just how screwed the US is. The following chart comparing GDP growth to the elder demographic of the population offers some serious doubts that the Fed will ever be able to step away. With the Boomers retiring en masse, 65-or-overs will represent over 20% of the population within a decade and thus no economic growth. Japanization here we come… and no end to QE or the entire status quo is over.
GDP growth correlates strongly with the percentage of population over 65 (with Greece, depression and Japan, hyper-QE the stand-outs) …
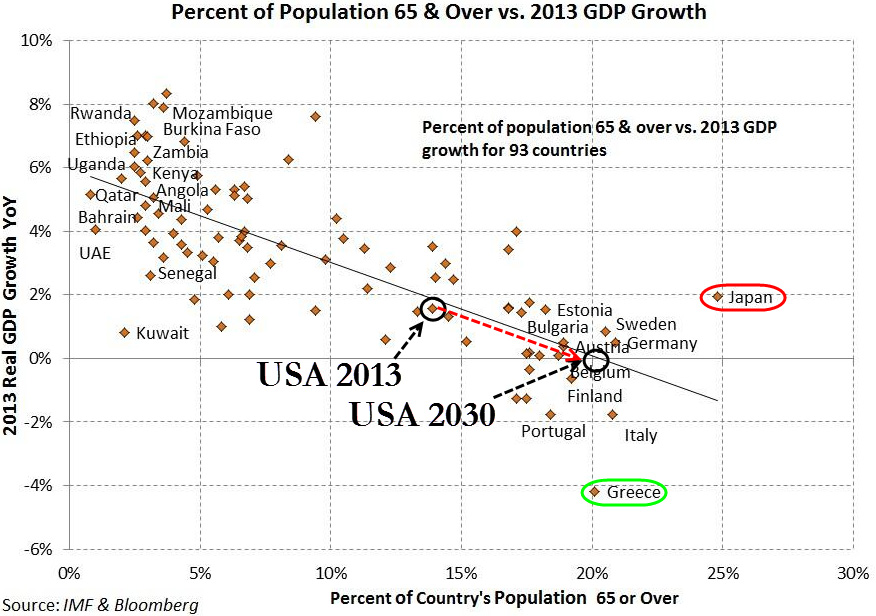
It doesn’t look good for the US…
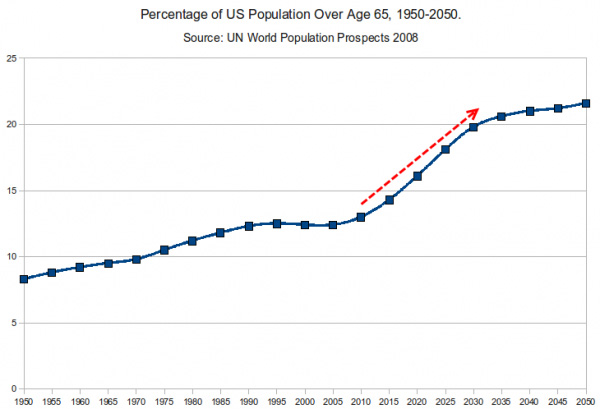
You can’t print more young people to change this percentage… so they’ll have to keep printing money to prop up asset markets to maintain the bumpy illusion of growth.
Hmm … Not good.
Factory Production in U.S. Falls by Most Since 2009 (Bloomberg)
Factory production in the U.S. unexpectedly declined in January by the most since May 2009, adding to evidence severe winter weather weighed on the economy.
The 0.8% decrease at manufacturers followed a revised 0.3% gain the prior month that was weaker than initially reported, figures from the Federal Reserve showed today in Washington. The median forecast in a Bloomberg survey of economists called for a 0.1% advance. Total industrial production dropped 0.3% even as utility output climbed the most in almost a year.
Assembly lines slowed last month as colder weather tempered production, the Fed said, showing a pause in the momentum of an industry that's helped bolster the economy. A pickup in capital spending and faster hiring that drives consumer purchases will be needed to spur production gains.
See above.
The US Middle Class's Annual Missing $1.6 Trillion (Reuters)
The United States was the world's first middle-class nation, which was a big factor in its rapid growth. Mid-19th-century British travelers marveled at American workers' "ductility of mind and the readiness…for a new thing" and admired how hard and willingly they labored. Abraham Lincoln attributed it the knowledge that "humblest man [had] an equal chance to get rich with everyone else."
Most Americans still think of themselves as middle class. But the marketing experts at the big consumer goods companies are giving their bosses the unsentimental advice that the middle class is an endangered species. Restaurants, appliance makers, grocery chains, hotels are learning that they either have to go completely up-scale, or focus on bargains for the struggling and budget-conscious.
Current income surveys, for statistical reasons, usually segment families by broad categories, which obscure the recent radical shift of income to a thin stratum of the super-rich. Well-to-do people may buy $100 coffee pots, but the lion's share of the income growth has been going to folks with five houses and staff to make the coffee.
For the last 15 years, an international consortium of economists has been building data bases on the income shares of the richest people in the developed countries, based on pre-tax market income including capital gains and tax-exempt income, and excluding government transfers. The American data reveals the greatest inequality by far, followed by Great Britain.
The stunning income distribution has a remarkable symmetry. In 2012, the top 10% captured half of all reported income. But the top 1% got almost half of that — 22.5% — while the top 10th of 1% (0.1%) captured half of that. All three are within a few decimal places of the previous highs — which occurred in 1928, just before the market crash that ushered in the Great Depression.
The%ages don't quite capture the violence of the skew. The stock market implosion of the 1930s followed by World War II's strict price controls and high marginal taxes brought the top 1%'s income share down to about 9% by the end of the war. Executive and financial sector pay was quite restrained, even through the good times of the 1950s and 1960s, and the 1%'s income share did not start to rise until the late 1970s. It took off for the stratosphere then — amid the oceans of cash sloshing around Wall Street during the 1980s leveraged buyout boom.
The sums involved are enormous. The difference between the 1%'s income share in 1975 (8.9%) and today's 22.5% is 13.6%. That additional share of personal income is worth $1.6 trillion. Each year.
Even the right wing techno happy press is falling in line.
Eurozone crisis is just getting started (Telegraph)
With elections in May likely to give rise to the most Eurosceptic parliament in the EU's history, Europe's long-running financial and economic crisis is threatening to spill over into an all-encompassing political one. According to Berlin and Brussels, Europe's dark night of the soul – its most serious crisis since the Second World War – is now essentially behind us, with the promise of a slowly recovering economy and renewed political harmony to come. To my mind, it has hardly begun. Europe's epic attempt to impose political union on widely divergent countries is being broken on the back of economic hardship, popular discontent, and financial disintegration. [..]
In the eurozone, the will among senior policymakers to make the single currency work is undoubted, but they are increasingly out of touch with voters and are steadily losing their legitimacy. This progressive disconnect between the mainstream political class and its support base was at its most evident in reaction to the outcome of the Swiss referendum. Immediate retaliation was threatened. A similar kind of invective is reserved for British proposals to limit labour migration.
Yet Europe's elite must know that all high-income countries would vote the same way as the Swiss given the chance. The arrogance of political leaders who think they know better may have been tolerable as long as Europe was growing. But today they deliver only economic ruin, making their position, and the legitimacy of the EU project, ever more vulnerable.
Stir all this together, and we see a possibly irresistible pull back to the principles of national sovereignty at a time when survival of the euro requires the very reverse – greater levels of fiscal, political and economic integration. A titanic struggle looms. And they say the eurozone crisis is over.
We'll hear much more from EM markets. This ain’t over by a long shot.
Emerging-Market Funds Outflow Surpasses Total 2013 Sales (Bloomberg)
Less than two months into 2014, global investors pulled more money out of emerging-market stock and bond funds than the total amount they retracted last year. Investors withdrew $4.5 billion from funds in the week through Feb. 12, extending the total outflow this year to $29.7 billion, according to Barclays Plc, which cited data provider EPFR Global. In 2013, a total of $29.2 billion left funds investing in emerging-market assets.
Capital outflows are showing no signs of abating even as stocks and currencies from developing nations rose this month following the biggest equity losses in January since 2009. While investors including BlackRock Inc.'s Larry Fink say emerging-market assets are cheap, concerns about slowing growth in China, trade deficits in Turkey and the Federal Reserve's reduction of stimulus are weighing on investor sentiment.
"The fund flows data for EM remain negative, with retail-type investors leading the exit and recently joined by more visible institutional-type investor selling from equities," Koon Chow, the head of emerging-market strategy at Barclays in London, wrote in an e-mailed note today. "The turning point for EM will probably be when investors become more positive on EM growth, particularly in Asia."
Cherry pickin’ banks to go bust. An independent body should be in charge here, not the ECB.
Risky Loans in Europe Banks' Dark Corners to Be Exposed by ECB (Bloomberg)
A dark corner of European finance is about to be illuminated by European Central Bank inspectors who are sifting through loans that banks restructure for clients and don't fully disclose.
"What's scaring investors is the question of whether banks are giving money to companies that deserve to go bankrupt and keeping them alive to avoid recording losses," Mascia Bedendo, an assistant professor of finance at Bocconi University in Milan, said in a phone interview. "The amount of forborne and nonperforming loans is still very obscure."
Four of the continent's 10 biggest banks by assets don't quantify loans they renegotiate, company filings show. Less than one-third of 39 major lenders disclose what the European Securities and Markets Authority calls "clear quantitative information." None of the firms that publish figures, including Deutsche Bank and Intesa Sanpaolo, reveal as much as U.S. counterparts such as JPMorgan Chase & Co.
The ECB has asked the euro area's 128 largest banks to provide unprecedented detail about their lending as part of a review that will determine whether firms are giving borrowers easier payment terms to avoid showing loans as defaulted. Europe's political leaders, seeking to avoid a repeat of taxpayer-funded bailouts during the 2008 financial crisis, asked the central bank to take responsibility for regulating the biggest lenders from national watchdogs. [..]
Commerzbank and Norddeutsche Landesbank Girozentrale were among eight German banks that may fail the review, KBW said. National Bank of Greece SA, Italian lenders Banca Monte dei Paschi di Siena, Credito Valtellinese Scarl and Banca Carige, and Spain's Liberbank were also at risk, it said. Banks found to have failed the review and subsequent stress test will be required to recognize any losses the ECB identifies and raise capital should their reserves be insufficient.
Some firms may need to "disappear in an orderly fashion" rather than be recapitalized or merged with other banks, Daniele Nouy, hired as chief of the ECB's regulator in December, said in a Financial Times interview published Feb. 10 and posted on the central bank's website. She didn't name any lenders. "Forbearance is addressed in the comprehensive assessment," Nouy said in a response to questions relayed by an ECB spokeswoman.
Surprise!!!
Banks in London Devise Way Around Europe's Bonus Rules (NY Times)
Since the 2008 crisis, regulators around the world have tried to rein in bonuses, worried that big payouts encourage excessive risk-taking by bankers and traders. The European Union has gone further than most, limiting bankers to bonuses equal to one or two times their salaries.
But the bank giants operating in London — including Goldman Sachs, Bank of America Merrill Lynch and Barclays — are seeking to outflank the new restrictions. Responding to the law, they are structuring new pay packages that try to satisfy both their emboldened regulators and their very expensive employees.
So goodbye, big bonus. Hello, role-based pay. Other banks have called their new payments "allowances." At least one labeled it "reviewable salary."
One of the European lawmakers who led the push for bonus caps is not buying the semantic somersaults. "These are bonuses in disguise," said Philippe Lamberts, a Belgian member of the Green Party in the European Parliament. "I wonder how they will hold up in a court of law." The banks are nonetheless pressing on with the changes, with the goal of making sure their top talent in Europe gets paid.
Yet as the banks tie themselves in knots to comply with the bonus cap law, the new pay packages may undermine what bank regulators worldwide have sought to do for nearly six years: force banks to stagger the payment of bonuses over much longer periods. Such deferrals, as they are known on Wall Street, enable the money to be taken back if bets go bad.
"This may leave us not just no better off, but worse off from the management of systemic risk," said Andrew Tyrie, chairman of the Treasury Select Committee and a Conservative member of Parliament. The commission on banking standards that he led concluded, among other issues, that compensation needed to include longer deferrals and more take-backs to discourage excessive risk-taking.
But the new structures — which do not entirely replace bonuses — pay more upfront and leave less available to take back.
China needs to increase its borrowing just to stand still, no matter how much the government wishes to tighten.
China January New Loans, Aggregate Financing Exceed Estimates (Bloomberg)
China's broadest measure of credit exceeded estimates last month while money-supply expansion slowed, data from the People's Bank of China showed today. Aggregate financing was 2.58 trillion yuan ($425 billion), in January compared with the 1.9 trillion yuan median projection in a Bloomberg News survey of 12 analysts and 2.54 trillion yuan a year ago. New local-currency loans were 1.32 trillion yuan, compared with the 1.1 trillion yuan median estimate of economists.
President Xi Jinping and Premier Li Keqiang are trying to balance reining in credit expansion and shadow banking that pose risks of a financial crisis with supporting economic growth that's projected by analysts to be the slowest in 24 years in 2014. Today's data follow reports showing an acceleration in trade in January, declines in manufacturing gauges and the 23rd straight drop in the producer-price index.
M2, China's broadest measure of money supply, rose 13.2% from a year earlier, the Beijing-based central bank said in a statement on its website.
Pop. The. Bubble.
Hong Kong-Singapore Builder Slump to Deepen (Bloomberg)
Property developers in Hong Kong and Singapore will extend the biggest declines among global peers as government curbs deter buyers in Asia's most expensive housing markets, according to AMP Capital Investors.
The Chart Of The Day tracks Hong Kong's Hang Seng Property Index, Singapore's FTSE Strait Times Real Estate Index and the Standard & Poor's 500 Real Estate Index. The two Asian gauges sank to their lowest levels in at least 17 months last week. Home prices have dropped 4.3% from their high in Hong Kong, according to Centaline Property Agency Ltd.'s index. They fell 0.9% in Singapore last quarter, official data shows.
This article addresses just one of the many issues discussed in Nicole Foss' new video presentation, Facing the Future, co-presented with Laurence Boomert and available from the Automatic Earth Store. Get your copy now, be much better prepared for 2014, and support The Automatic Earth in the process!
www.theautomaticearth.com
|


