
Send this article to a friend:
January
09
2023

|
Send this article to a friend: January |
|
What Can Stop Gold Now?
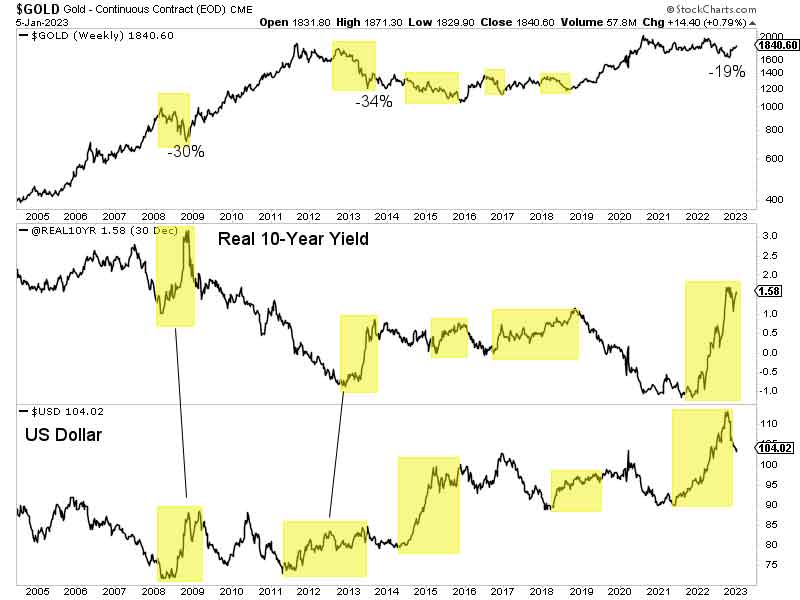
It is trending higher and positioned above rising 200-day moving averages when charted against the stock market, bond market, commodities, and foreign currencies. Yesterday it closed at a fresh two-year high against the conventional 60/40 portfolio. To be sure, on a technical basis, nothing will be able to stop Gold when it breaks to a new all-time high. Such would confirm the most significant Gold breakout in roughly 50 years. However, I am more focused on macro-fundamental developments that could stop Gold today. I don’t see anything. Consider the negatives Gold has dealt with over the past year. The Fed has raised rates at the second most aggressive pace in history. The US Dollar Index surged almost 30% in 17 months. The real 10-year yield gained more than 2.50%. It was the largest move in the history of the TIPS market. The rise in the US Dollar and real interest rates was much greater than the rise in 2013 and even larger than in 2008. Gold declined only 19% compared to 30% and 34% in 2008 and 2013.
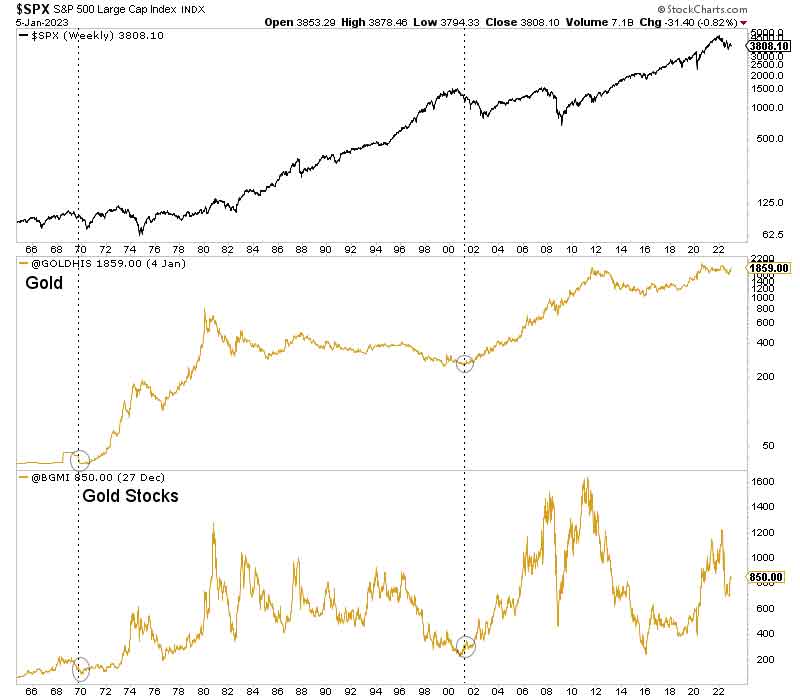
Various investors think the stock market will dump lower and take Gold with it. Ah yes. The 2008 playbook. This thought is based not on hard data or objective facts but on emotion. First, we must remember that precious metals typically bottom around 11 to 12 months (at the latest) after the stock market peaks. The market is beyond that point, and Gold and gold stocks have already bottomed after a two-year-long correction. Second, up until 2008, Gold had risen every year for seven years. At present, Gold is coming out of an 11-year-long secular bear market. The amount of capital in precious metals today is dwarfed by 2008. Third, the best comparison based on Fed policy, the structure of the bear market and economy is a combination of the 1968-1970 and 2000-2002 periods. Coincidentally, those downturns marked the start of secular bear markets in the S&P 500 and secular bull markets in Gold. The stock market would lose its 40-month moving average (low 3800s) during the next leg lower. As I have shown in the past, that is a powerful signal of the start of a new secular bear market. The vertical line in the chart below showed when the S&P 500 lost its 40-month moving average after the start of those secular bears. That is exactly when a bull market in precious metals can begin.
Gold has taken every blow (surging dollar, surging real interest rates, and aggressive Federal Reserve) yet is outperforming everything and is barely more than 10% from an all-time high. Despite strong bearish fundamentals, Gold has held up amazingly well. This is an extremely bullish development, lying under the surface. There will be corrections along the way, and Gold will have to chew through significant resistance from $1870 to $1950. But aside from that, there is nothing that will stop it. I continue to focus on finding high-quality juniors with at least 500% upside potential over the next few years. To learn the stocks we own and intend to buy, with at least 5x upside potential in the coming bull market, consider learning about our premium service.
Jordan Roy-Byrne, CMT is a Chartered Market Technician and member of the Market Technicians Association. He is the publisher and editor of TheDailyGold Premium, a publication which emphasizes market timing and stock selection, as well as TheDailyGold Global, an add-on service for subscribers which covers global capital markets. He is also the author of the 2015 book, The Coming Renewal of Gold’s Secular Bull Market which is available for free. TheDailyGold.com was recently named one of the top 50 Investment Blogs by DailyReckoning and WalletHub.
|
Send this article to a friend:
 |
 |
 |

![[Most Recent Quotes from www.kitco.com]](http://www.kitconet.com/images/live/s_gold.gif)
![[Most Recent USD from www.kitco.com]](http://www.weblinks247.com/indexes/idx24_usd_en_2.gif)
![[Most Recent Quotes from www.kitco.com]](http://www.kitconet.com/images/live/s_silv.gif)