
Send this article to a friend:
January
07
2022

|
Send this article to a friend: January |
|
Money supply and rising interest rates
That is about to change. The world of continual Keynesian stimulus is coming to its inevitable end with prices rising beyond the authorities’ control. Being blinded by neo-Keynesian beliefs, no one is prepared for it. This article explains why interest rates are set to rise substantially in this new year. It draws on evidence from the inflation crisis of the 1970s, points out the similarities and the fact that currency debasement today is far greater and more global than fifty years ago. In the UK, half the current rate of monetary inflation for half the time — just for one year — led to gilt coupons of over 15%. And today we have Fed watchers who can only envisage a Fed funds rate climbing to 2% at most… A key factor will be the discrediting of this Keynesian hopium, likely to be replaced by a belated conversion to the monetarism that propelled Milton Friedman into the public eye when the same thing happened in the mid-seventies. The realisation that inflation is always and everywhere a monetary phenomenon will come too late for policy makers to stop it.
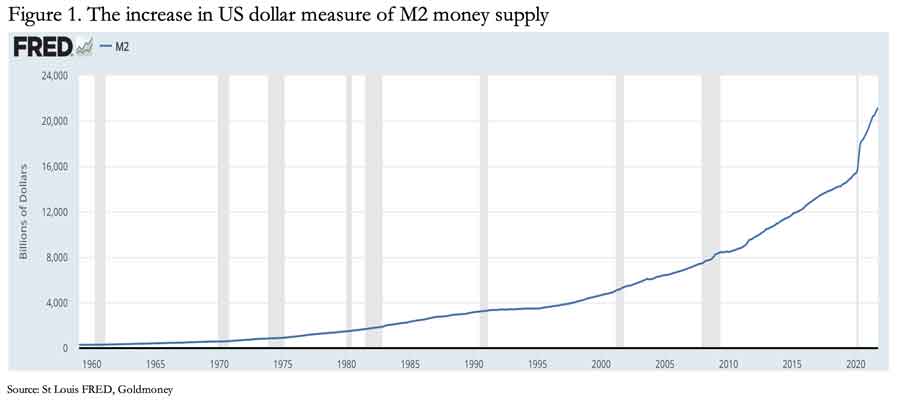
The situation is closely examined for America, its debt, and its dollar. But the problems do not stop there: the risks to the global system of fiat currencies and credit from rising interest rates and the debt traps that will be sprung are acute everywhere. Introduction Clearly, the outlook is for higher dollar interest rates. The Fed is trying to persuade markets that it is a temporary phenomenon requiring only modest action and that while inflation, by which the authorities mean rising prices, is unexpectedly high, when things return to normal it will be back down to a little over two per cent. There’s no need to panic, and this view is widely supported by the entire investment industry. Unfortunately, this narrative is based on wishful thinking rather than reality. The reality is that over the last two years the dollar has been dramatically debased as part of an ongoing process, as the chart in Figure 1 unmistakably shows.
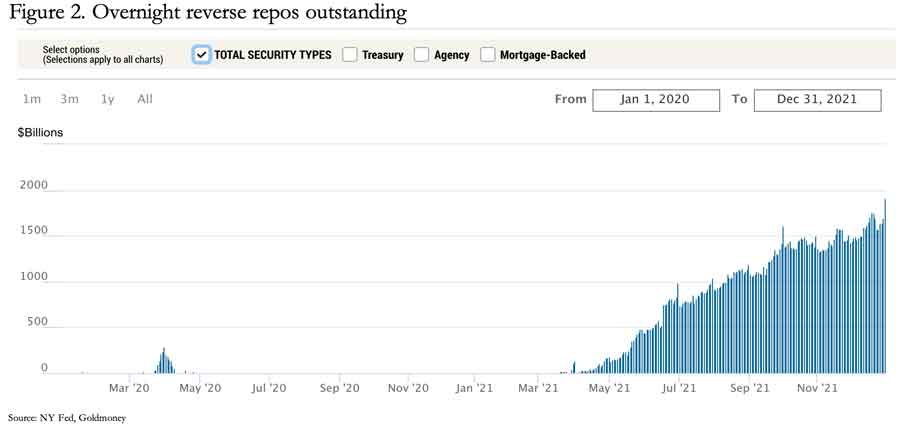
Since February 2020, M2 has increased from $15,470 to $21,437 last November, that’s 38.6% in just twenty months, an average annualised inflation rate of 23.2% for nearly two years on the trot. And that follows unremitting expansion at an accelerated pace since the 2008 Lehman crisis, an inflationary increase of 175% since August 2008 to November 2021. If the CPI is the relevant measure, then its current indicated rate of price inflation at 6.8% is only the beginning of upward pressure on prices. For now, markets are ignoring this reality, hoping the Fed is still in control and can be believed. But we can be sure that it will soon become apparent that the monetary authorities have a major problem on their hands which will no longer be satisfied by jaw-jaw alone. Interest rates will then be destined for significantly higher levels, not because there is demand for capital against a background of limited savings supply, but because anyone holding dollars will require compensation for retaining them. A similar error is to think that with economic growth slowing from its initial recovery and with concerns that the world may be entering a recession, demand and supply will return to a balance and prices will stop rising. These errors aside, the 10-year US Treasury, which is currently yielding 1.7% cannot continue for long at these levels with CPI prices rising at 6.8% and more. And in the next few months, with higher producer prices, energy, and raw material costs in the pipeline the pressure for a substantial upwards rerating of bond yields (which is a catastrophic fall in prices) is only going to increase. International investment flows This article is less concerned with the implications for financial asset values than with how such a shock will affect the currency and confidence in monetary policy. The dollar is over-owned by foreign interests, which with cash deposits and investments now exceed $33 trillion, 145% of estimated current US GDP and not too far from the Bank of International Settlements’ estimate of US non-financial core debt.[i] Of this foreign ownership, nearly $27 trillion is in long-term securities, with private sector ownership of equities by foreign investors standing at $12.5 trillion within that figure.[ii]It should be appreciated that nearly all foreign ownership of US equities is with profits in mind only: foreigners may be required by their regulators to hold domestic equities, but there is no such requirement covering foreign equities. Consequently, an increase in interest rates of a magnitude suggested by the dollar’s debasement can be expected to trigger an avalanche of foreign selling of all classes of financial assets. Whether they sell the dollar as well will depend partly on how high interest rates are permitted to rise, and partly on alternative currency, precious metal, and commodity options. Countering foreign investment in USD financial assets, US residents’ investment in foreign currency assets is far less, with only $651.4bn of foreign currency deposits and short-term investments, one tenth of foreign entitlements to dollar bank deposits and ownership of Treasury and commercial bills. But ownership by US investors in long-term foreign securities stands at $15.7 trillion, less than half the foreign position in US securities, of which $12 trillion is in equities. A bear market in US stocks will therefore lead liquidation of foreign stocks as well, ensuring an equity bear market in the US will become truly global. But the net effect on the dollar is likely to be negative Another aspect for foreign holders of dollar assets to consider is the ongoing supply of dollars and dollar credit. So far, the prospect of further dollar debasement relative to other currencies has not been reflected on the foreign exchanges because the other major currencies face similar outcomes. This may be changing. The euro and Japanese yen have weakened significantly recently with the ECB’s and Bank of Japan’s deposit rates trapped below the zero bound. The inability of governments and monetary authorities to escape from currency debasement is what will ultimately matter, setting the scene for purchasing power, interest rates and systemic instability. For now, prospects for the money supply of the world’s reserve currency are central to these issues. Does M2 truly represent the dollar’s money supply? In February 2021 the Fed changed the components in M1 and M2 and began to report them monthly instead of weekly. Put simply, savings deposits at the banks were added to M1, which accounted for a large jump in the M1 total. Adjustments to prior figures were only backdated to May 2020 onwards, rendering it useless for comparisons with data prior to that date. The composition of M2 was left unchanged.[iii] There are two additional factors, which arguably should be included in M2. The first is IRA and Keogh accounts at the banks. Presumably, they are excluded on the basis that they are not readily available for consumer spending, and if they are withdrawn from one bank, they must be deposited in another. But this ignores the fact that they are part of the deposit money which banks deploy for their dealings in credit, and that the total of these deposits varies. They should therefore be included in any bank deposit-based definition of the money supply. The effect of including these balances is to increase M2 today by $974bn (November 2021).[iv] The second factor is the treatment of repurchase agreements (repos and reverse repos or RRPs), which are tools for liquidity management both between commercial banks and between the banks and the Fed. We are not concerned with inter-bank repos, because they do not affect the overall amount of currency and credit in circulation. But when the Fed is one counterparty, the situation is different. Readers may recall the liquidity crisis in September 2019, when the Fed stepped in and provided finance by providing repos to commercial banks. When the Fed acts in a repo transaction, it buys high quality assets (usually US Treasury bills, Treasury bonds or agency debt) with an agreement to sell them back on pre-agreed terms, which will give the Fed a profit, currently set at an annualised rate of 0.05%. The selling bank then has use of the cash proceeds over the duration of the repo, until the transaction is completed by the bank repurchasing the collateral from the Fed on the pre-agreed terms, thereby returning the cash. Because these transactions are short-term, usually providing overnight liquidity, there is little point in including them in money supply statistics. A reverse repo is the other side of a repo transaction. If a commercial bank has too much liquidity on its balance sheet it can use a reverse repo to provide it to another bank in need of liquidity on profitable terms. But if the Fed is the counterparty to a bank or eligible institution in a reverse repo then liquidity is being taken out of general circulation reducing money supply on a short-term basis. Therefore, an increase in the Fed’s reverse repo book reduces the M2 money supply figure below what would otherwise be reported. For the Fed, repos and reverse repos are overnight liquidity management tools to allow the Fed to keep its funds rate within the limits set by the Open Markets Committee. Repos are deployed to put a cap on interest rates and reverse repos a floor. But commercial banks are unlikely to make use of the reverse repo facility. The only way a bank will be encouraged to enter a reverse repo transaction with the Fed is as a dealer in credit. The return on an RRP must exceed alternative uses of the liquidity available to a bank on the liability side of its balance sheet. Banks will not undertake a reverse repo with the Fed because the rate is fixed at 0.05%, which is less than the interest paid on bank reserves at 0.15%. But on 31 December last week, the Fed’s total reverse repo operations stood at $1.905 trillion (it has since declined by $400bn because in the last few trading sessions the yield on 13-week T-bills has risen to 0.085%, giving a higher yield than that offered by the Fed’s reverse repo facility). Nonetheless, outstanding overnight reverse repos are still a very large item. If commercial banks are disinterested because they earn more on their reserves, then who are the Fed’s counterparties? The answer is money funds. Money funds faced two problems. With interest rates fixed by the Fed at the zero bound, there is a heightened risk that they will “break the buck”, in other words they would no longer be able to guarantee to return their investors’ capital. The second problem is that commercial banks are no longer interested in acting as counterparties in wholesale money markets absorbing money funds’ liquidity. The issue is Basel 3’s net stable funding ratio rules introduced on 1 July. The NSFR is intended to ensure that banks have stable funding for their activities, and a bank exposed to large depositors, who might withdraw their deposits at little or no notice, for the purpose of the NSFR rules do not constitute a stable source of funding. Consequently, banks are no longer interested in taking in deposits from the money funds permitted to deposit money with them through wholesale money markets.[v] Therefore, all money funds are driven towards the New York Fed’s Open Market Trading Desk to earn a paltry 0.05% on their funds when the yield on 13-week T-bills declines towards the zero bound. This facility was specifically opened to them in March 2020 when the Fed reduced its funds rate to 0—0.25%. Ahead of the NSFR’s introduction to US bank regulations last June, the Desk’s reverse repo facility stood at just a few billion from which it exploded to nearly $2 trillion last week, coincided with the NSFR’s introduction. And for money funds restricted to dealing in T-bills and the Fed’s reverse repos, the T-bill rates also dropped. The consequences for the Fed’s reverse repo facilities is illustrated in Figure 2.
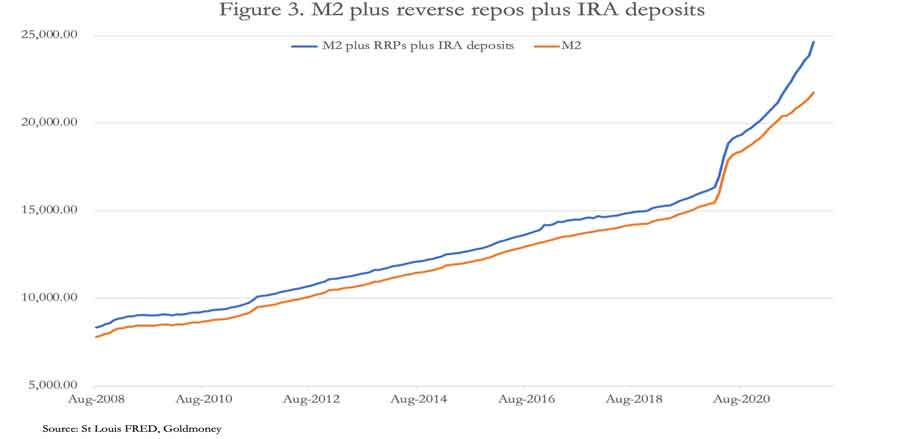
There is little doubt that in the absence of the Fed’s intervention that money funds’ cash placed with commercial banks would be recorded as part of the deposit-based money supply, and that on a change in the interest rate situation, it is likely to flood back into circulation. Money funds invested in short-term Treasury instruments, which is most of them, are reflected in bank deposits when it is spent out of the government’s general account. Therefore, like the IRA and Keogh balances, the Fed’s reverse repos distort M2 and should be added to broad money M2 to give a truer picture of the quantity of currency and credit in circulation, despite the timing differences involved. M2 and M2 adjusted for these items are shown in Figure 3 below.
The funding precedent from the 1970s With currency and credit increasing at this rate, it is only a matter of time before the US Government will find its funding costs rising materially. Not only will that change the outlook for its spending plans, but there is a risk of periods of funding disruption. Relying on its proven auction process may no longer be wise.It is well worth revisiting the 1970s precedent to today’s financial conditions. It was the last time there was an inflation-linked funding crisis. But it wasn’t the US Government that suffered, because it ran relatively small budget deficits relative to the economy at that time — the largest being an unprecedented $74 million in 1976 (compared with $3,131,917 million in 2020, over 42,000 times the 1976 deficit!). It was the UK that had problems, but on a far smaller relative scale. Periodically, the Bank of England, acting for the UK Treasury, was unable to fund its budget deficit, which peaked at 6.9% of GDP in 1975/76, forcing the then Chancellor (Denis Healey) to borrow $3, 900 million from the IMF to cover the entire deficit. Following this episode, IMF restrictions on government spending capped the UK budget deficit at approximately 5% in the years following, and the rate of price inflation, which had peaked at 25% in 1975, declined to 8.4% in 1978. Furthermore, in late-1973 there had been a combined commercial property and banking crisis on a scale never seen in the UK before. And in the bear market in equities between May 1972 and the end of 1974 the FT 30 Share Index lost over 70%. More than anything else at the time, this episode discredited Keynesianism. For comparison, the US deficit to GDP ratio in 2020 was 11.6% in 2020 and 10.3% in 2021, nearly double that of the UK at the height of its crisis, but so far for two consecutive years. With similarly socialist policies which led to a sterling crisis forty-five years ago, the dangers facing the dollar, which are potentially far greater, are yet to materialise. And the IMF cannot come to the rescue of the US, as it did for the UK in 1976, and Greece in 2010-12. Crucially, the Bank of England lacked the tools to hide the true extent of monetary inflation. Repos and reverse repos didn’t exist in the UK until the early 1990s. Intentionally or not, to a degree central banks can massage the numbers today with the financial press being none the wiser. But that changes nothing, other than fooling markets for just a little longer. Back in seventies’ Britain, the initial cause of a series of funding crises was that the Bank of England, under pressure from politicians, did not accept the market’s demands for higher interest rates. This sent a negative message to foreign holders of sterling, weakening the exchange rate, triggering foreign selling of gilts, and raising fears of further imported price inflation. Meanwhile, government spending continued apace (as described above), pushing extra currency into circulation without it being absorbed by debt issuance funded by genuine savings. And as sterling weakened and money supply figures deteriorated at an increased pace, yet higher interest rates would be required to persuade investing institutions to subscribe for new gilt issues. The longer the delay in accepting reality, the greater the chasm became between market expectations and the authorities’ position. Only then would the politicians and the Keynesians at the UK’s Treasury throw in the towel. The Bank of England then had the authority to fund at its discretion. It deployed what became known in the gilt market as the Grand Old Duke of York strategy, after the nursery rhyme: “He had ten thousand men. He marched them up to the top of the hill, then marched them down again.” The Bank of England would raise interest rates high enough to take all expectations of higher rates out of the market, then issue gilt stocks to absorb pent-up investment liquidity before allowing and encouraging rates to fall again. That was how 15% Treasury 1985, 15 ¼% Treasury 1996 the 15 ½% Treasury 1998 gilts came to be issued on separate occasions. At the top of the interest rate hill and following the announcement of the terms of the new gilt, sterling would rise, the crisis passed, and the money supply figures corrected themselves. Paul Volcker at the Fed did something similar at the Fed in June 1981 when he raised the Fed funds rate to 19.1% — except the objective was less about funding and more about killing expectations of price inflation. Though they are being ignored, there are worrying similarities with the Fed’s position today. The budget deficit has been and remains far higher than the one that forced the UK to call in the IMF, as much as 11.6% of GDP and over 42,000 times the US deficit in 1976. With a US economy bound to be impacted by rising interest rates, the outlook is not recovery as forecast by the Congressional Budget Office, but for further deterioration, requiring continual inflationary funding. The Fed is reluctant to acknowledge the argument for significantly higher interest rates, and risks losing control over them. It is in this context that reverse repos have come to the Fed’s partial rescue by suppressing statistically the true rate of growth in currency and credit. That will unwind in the coming months A further lesson from the 1970s was that they commenced with Keynesianism in vogue, which became gradually discredited, notably in the wake of the UK’s 1976 crisis. Monetarists, such as Milton Friedman, gained credibility, and with it a growing recognition that “inflation is always and everywhere a monetary phenomenon”. Today, neo-Keynesianism appears as entrenched in monetary policy committees than they were in the early seventies. We can be reasonably sure that as prices, interest rates, and currency and credit quantities continue to rise, that Keynesianism will be discredited again, and a new realisation based on monetarist principals will gain ground. When investors in US Treasuries begin to drift away from failed Keynesian arguments and understand the Fed’s dilemma is in a monetary context there can be little doubt that US Treasury auctions will begin to experience failures. How the Fed responds will be crucial: will it be reluctant to raise interest rates sufficiently? Almost certainly the answer is in the affirmative, because of the economic damage to highly indebted businesses and government finances.
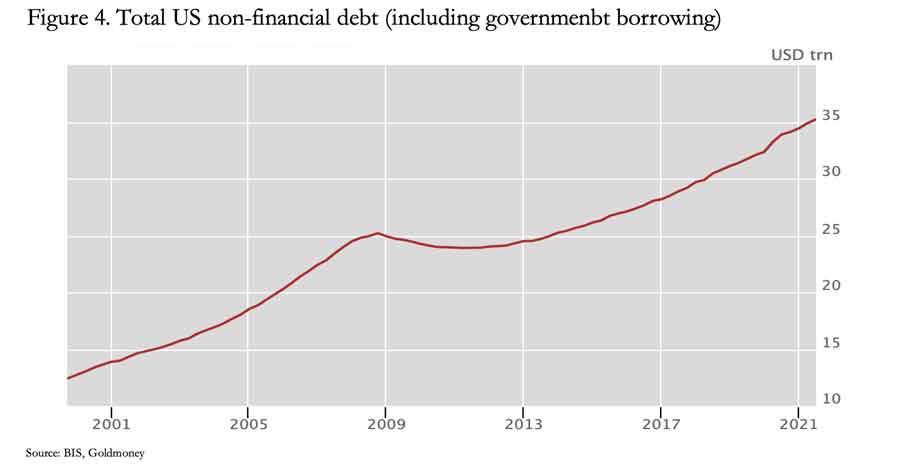
And no one yet is contemplating Treasury coupons at anything like the 15% seen in UK gilts in the far milder inflationary conditions of the 1970s. The rate of US M2 growth recently is the highest by far since records began, even greater than at any time in the two World Wars and compares with a maximum of rate of 13.8% in February 1976, half of that today.[i] The dangers from rising interest ratesWe now turn to the consequences of rising interest rates on the money supply, and the impact on government funding. There seems little doubt that as rates move above the zero bound, so long as T-bill rates remain above the Fed funds rate minimum target that money funds will no longer use the Fed’s reverse repo facility. Indeed, earlier this week a jump in the yield of the thirteen-week T-bill to 0.085% has already coincided with a reduction of $400bn in overnight reverse repos.From the money funds’ viewpoint, the risk of “breaking the buck” disappears as the Fed funds rate moves above the zero bound, and a purchase of short-term T-bills becomes an increasingly profitable alternative. These money funds are likely to increase their buying of T-bills, which will be credited to the government’s general account at the Fed. The funds gained in the general account will be subsequently drawn down and spent by the Federal Government, when they will then be reflected as bank deposits adding to M2 money supply. With this ready source of short-term funding, there is a danger that the government will rely increasingly upon it, making government finances more immediately exposed to rising interest rates. And with the growth of reverse repos having initially slowed down the growth of M2, its subsequent release into deposits as the government spends it out of the general account risks accelerating its growth subsequently at a time when Keynesian policies are being discredited in favour of monetarism. The Fed only agreed to deal with money fund counterparties as a temporary measure in March 2020 to ensure that large deposits from them did not face negative deposit rates from banks while the Fed funds rate was at the zero bound. But when rates move up, the money fund problem disappears, and the facility may be withdrawn. But with interest rates rising, the Fed will have a far greater problem dealing with the economic fallout. We can all agree that rising interest rates increases the burden on all borrowers exposed to market rates, while those who have locked in low fixed rates merely have the problem only deferred over the length of their loans. Rising interest rates and national debts According to the Bank for International Settlements total non-financial core debt for the US stood at $35.2 trillion at the end of 2021 Q2 (other estimates appear to be higher). The trend since 2000 is illustrated in Figure 4.
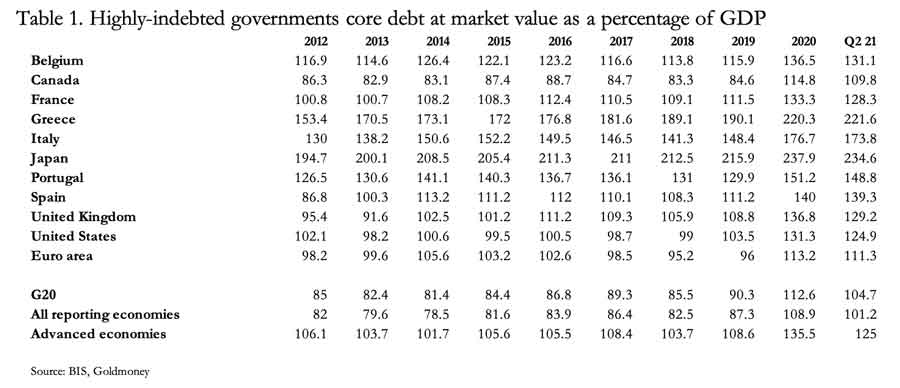
Mounting non-financial debt is a global problem, with the US at 286% compared with its GDP, the Eurozone at 284%, the UK at 290%, Japan at 416.5%, Switzerland at 308%, and China at 285% (BIS figures for 2021 Q2)[i]. The springing of debt traps by rising interest rates of more than a few per cent is bound to destabilise the entire global economy. As well as the Fed, the other central banks will be acutely aware of their own situation and we can be sure that G7 finance ministers and central bankers will try to coordinate interest rate policies, by which we mean doubling down on their suppression. The recent situation for highly indebted national governments is shown in Table 1.
In a joint paper, economists Carmen Reinhart and Ken Rogoff concluded in 2010 that “…public debt levels of debt/GDP that push the 90 per cent threshold are associated with lower median and average growth”.[i] In other words, all the countries in Table 1 will find it difficult, if not impossible to grow their way out of these peacetime debt levels. Highly indebted national governments, such as Belgium, Greece, Italy, Portugal, and Japan will struggle to survive a rise in global interest rates without being in the front line of a funding and systemic crisis. And the Eurozone nations in Table 1 will almost certainly destabilise member states with less direct exposure to debt traps. Only recently, President Macron of France and Prime Minister of Mario Draghi of Italy wrote a joint article calling for “The EU’s fiscal rules to be reformed”.[ii] For “reform”, read increase borrowing levels. In other words, having achieved government debt to GDP ratios of 128% and 174% respectively, they now want to increase these debt levels even further. The race into a European debt crisis is bad enough. But Japan is particularly alarming, with government debt obligations further extended in a policy of supressing risk premiums on corporate loans and subsidising a wide range of consumer goods with the result that over 50% of the consumer price index is government controlled.[iii] With interest rates trapped beneath the zero bound, a rise in global rates is set to deliver a currency crisis for the yen. Japan’s banking system is also highly leveraged, with debt to GDP levels for all their large systemically important banks of over twenty times. China has a far lower level of government debt to GDP. But its heavily indebted non-financial private sector has an estimated $27 trillion equivalent and cracks in the system are already becoming evident with the Evergrande crisis. Summary and conclusion It seems extraordinary that the link between changes in the quantities of currency and credit, epitomised by deposit-based monetary statistics, is being totally disregarded by governments, monetary authorities, and the entire investment establishment. But that is certainly the case today. And no one seems to expect much more than an increase of a few percentage points in global interest rates.We should not be surprised, therefore, that rising prices measured by the CPI have caught the whole establishment unawares. Nor should we be surprised that the current situation continues to be analysed through a neo-Keynesian lens, when we know it has led us to the current crisis. The crisis is now of debt traps not just for the US Government, but in all the other major jurisdictions. The Keynesian belief that government economic and monetary management is superior to free markets is set to be discredited by market reality, which can only be suppressed so far. It has led to savers being forced to accept deeply and further deepening negative yields on their bond investments. So far, they have been prepared to have their pockets picked by this means, but that cannot last. When it becomes clear that inflation of prices is only a marker for currency debasement, and that this debasement can only continue, these deeply negative rates will no longer be available to subsidise profligate government spending. The scale of an interest rate and bond market crisis for everyone’s reserve currency appears to be severely underestimated. The sudden emergence of runaway price inflation has led to tentative comparisons being made between the current situation and the 1970s. But so far, there is little evidence that these comparisons are being taken seriously enough. If they were, analysts would have to conclude that events in common with the 1970s which led to high nominal bond yields and coupons in UK gilts exceeding 15%, are potentially far more destabilising today than they were then. That being so, the world is on the edge of a substantial bear market in financial assets driven by global bond prices normalising from the current deeply negative real rates to levels that truly reflect deteriorating government finances. All financial asset values will be undermined by this adjustment. It is increasingly difficult to see a way out of these difficulties, and the Keynesian hope that economic growth will deal with the debt problem is simply naïve. In 2010, respected economists (Carmen Reinhart and Kenneth Rogoff) concluded that at a government debt to GDP rate of over 90% it becomes exceedingly difficult for a nation to grow its way out of its debt burden. With advanced economies averaging a ratio of 125%, Japan and Greece at over 200%, and some Eurozone nations at over 150%, there are debt traps almost everywhere ready to be sprung. In highly indebted fiat currency economies, there can only be one outcome: once one falls into a crisis, the others will follow with accelerating currency debasements leading to the destruction of faith in their currencies as well. And with a government core debt ratio to GDP of 125%, the US with its dollars is up there with the others to be destabilised, being over-owned by foreigners, and transmitting risk to all currencies that regard the dollar as its principal reserve currency. It can only be concluded that as we enter a new year the adjustment to market reality is likely to be more violent than anything seen in the 1970s.
[ii] All foreign ownership statistics taken from the US treasury’s TIC figures. [iii] See the Fed’s announcement at federalreserve.gov/feeds/h6.html [iv] See https://fred.stlouisfed.org/series/ira [v] See https://www.bis.org/bcbs/publ/d295.pdf . See Table 1 on page 6: large non-financial and financial corporate deposits suffer a 50% ASF haircut. [vi] See https://www.ft.com/content/6536113f-f509-41e2-bee0-597ed90843b6 which points out that 2020’s surge in US money supply is the highest for 150 years. [viii] See Growth in a time of debt, Carmen Reinhart and Kenneth Rogoff: American Economic Review —Papers and proceedings 100 (May 2010) pp 573—578
[ix] Financial Times 23 December 2021.
[x]See Mises Wire, Japan’s inflation is hidden behind central bank-financed subsidies by Taiki Murai and Gunther Schnabl —3 January 2022
|
Send this article to a friend:
 |
 |
 |

![[Most Recent Quotes from www.kitco.com]](http://www.kitconet.com/images/live/s_gold.gif)
![[Most Recent USD from www.kitco.com]](http://www.weblinks247.com/indexes/idx24_usd_en_2.gif)
![[Most Recent Quotes from www.kitco.com]](http://www.kitconet.com/images/live/s_silv.gif)