
Send this article to a friend:
January
03
2020

|
Send this article to a friend: January |
|
Gold Price Forecast: Gold To Rise On Fed Dollar Debasement
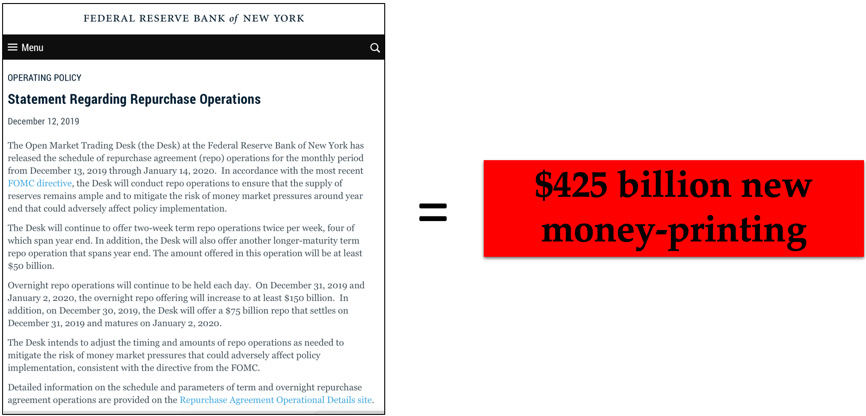
We are starting to get a stronger sense of what will be causing 2020’s advance in gold and silver: weakness in the US dollar and a concurrent inflationary spike in the entire commodity sector. Gold and silver sometimes act on their own, independent of what is happening to the broader commodity world. However, at other points gold and silver will get pulled together with the rest of the resource sector – this is what is about to occur in the precious metals world. Fed Debases Dollar Evidence for dollar weakness just ahead and lasting for at least the first half of 2020 is growing. Last week saw the Federal Reserve hold steady its benchmark interest rate, which remains at a range of 1.50% - 1.75%. However, the bigger news was the announcement of $425 billion in new money-creation via the repurchase (“repo”) market, an operation which is designed keep overnight borrowing in the banking system flowing.
The market does not need the Fed to intervene in the repo market, nor in any market for that matter. If lending in the repo market has gotten tight, there is a reason for that: lenders are cautious due to dubious fundamentals within the wider economy. The idea that the Fed should act to supersede the independent decision-making of individual institutions involved in the repo market is one that leads to a slippery slope of moral dilemma as problems grow larger and larger.
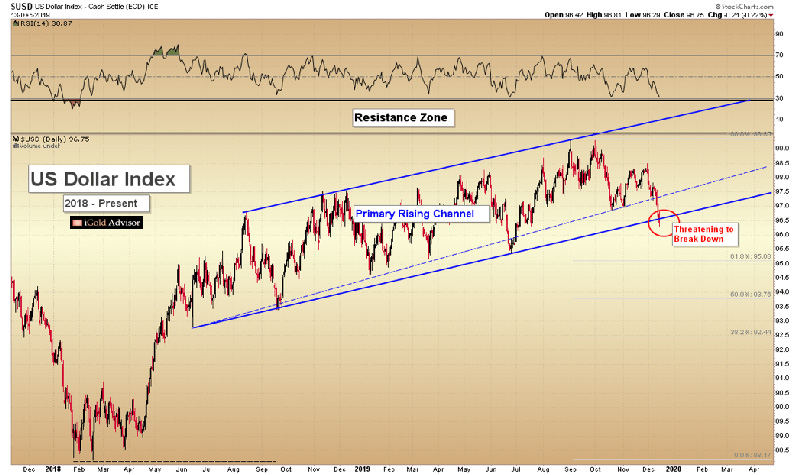
Not only did the Fed outline a new $425 billion “liquidity” program this week, it also promised to print more money by buying short-term US Treasury bonds if financing pressures required such. Fed Chairman Jerome Powell stated explicitly: “Federal Reserve would consider buying short-maturity coupon-bearing Treasuries… if financing pressures hinder the central bank’s ability to administer its interest-rate policy.” The Fed can call it whatever it wants, but money-printing is money-printing, and the impact of the announcement was seen in the value of the dollar, which was down nearly half a percentage point for the week. Dollar Clings to Support Yet it is not so much the single-week dollar action which is important here; rather, it is where recent weakness has left the dollar on its longer-term charts. The dollar is now just clinging to its primary 18-month rising support band (blue) at 96.5:
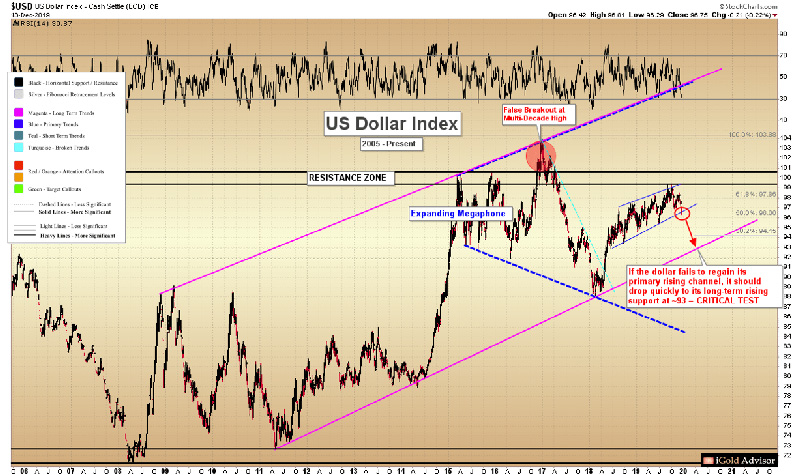
For the week the US currency first briefly violated the support at 96.5, before closing at 96.7, just a fraction above. After a year and a half in which the dollar has been within an abnormally low-volatility trend – any more dollar selling over the next 1-2 months will solidify what will be a significant intermediate-term breakdown. Putting this into perspective, should the dollar fail at 96.5 over the coming weeks, there is little visible support on the chart until 93.0, which is a critical “do or die” long-term support trend, dating all the way back to 2011 (bottom, magenta):
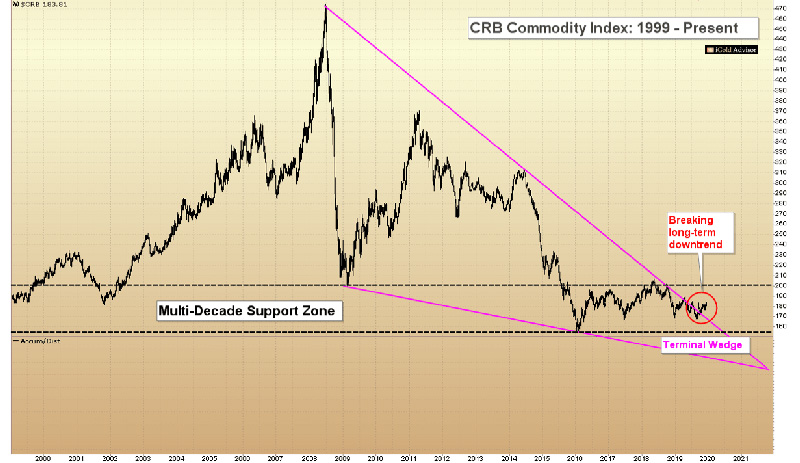
Should the dollar fail at 93.0, it would enter long-term bear market territory in our books – however, let us not predict such a move quite yet. To do so would be to get ahead of ourselves. There will be plenty of time to prepare for perhaps a decade or two of dollar deterioration after we see 93.0 broken – for now, we consider it a critical test which is likely to occur within the first half of 2020, after initial weakness due first. Commodities Respond to Dollar Weakness Commodities – as tangible assets that cannot be printed at the whims of central bankers or politicians – appear to be predicting ahead of time that this dollar weakness is ahead. Note that the CRB commodity index, a basket of 19 natural resources which includes gold, silver, platinum, palladium, copper, oil, natural gas, coffee, corn, cotton, wheat, cattle, and lean hogs among others, is now officially breaking its 12-year downtrend, a line of sellers which forms the upper boundary of a multi-decade terminal wedge bottoming pattern:
This is extremely constructive price action to observe if one is bullish over the long-term on commodities. Initial Commodity Targets The break of a 12-year terminal wedge pattern does not necessitate a new bull market will start immediately. However, it does strongly suggest that the worst of the decline is over, and that stability in commodities is now ahead. [Note: each commodity will behave differently. While this analysis does apply to the average of 19 commodities in the index, it will not apply to each individually within the group. We will begin covering more diverse commodities in 2020.] Following some years in which supply and demand should roughly be in equilibrium, growth in world industry and population will set the stage for the next bull market in natural resources, later in the 2020’s. Yet over the short-term, the break of the 12-year terminal wedge does suggest that a notable surge across the average of commodities is likely for the first six months of 2020. It is this surge which will be a primary driver for gold and silver’s next advances. Targets cannot be derived from terminal wedge bottoming formations alone. Other forms of analysis must be used to predict targets following such breaks. At this juncture, the only target we can state with a high degree of probability is that the CRB commodity index should reach the upper range of its multi-decade support zone (black), which comes in at 207 on the index. From the present close of 183, such would represent a 12.5% advance across the average of commodities into the first half of 2020. While this figure is certainly nothing that would catch mainstream headlines, if gold advanced a similar 12.5%, it would target $1,665. Meanwhile, silver would target $19.15. If additional buying comes into the metals beyond broad commodity participation, these will be starting figures only. Takeaway on the Fed, the US dollar and Commodities The big point here is that commodities are breaking a 12-year downtrend, and some level of a surge is thus highly anticipated over the next six months. Gold and silver are going to receive capital inflows when the entire CRB index advances. The break on the CRB’s terminal pattern is occurring now – and this appears to be happening in anticipation of further dollar weakness. In effect, the commodity complex is predicting that the dollar will fail at its primary rising trend at 96.5 shortly. The Fed has announced $425 billion in new money-printing. Commodities are getting the message and are turning. Gold and silver will likewise receive inflows. The macro backdrop is setting up for an exciting 2020.
|
Send this article to a friend:
 |
 |
 |


![[Most Recent Quotes from www.kitco.com]](http://www.kitconet.com/images/live/s_gold.gif)
![[Most Recent USD from www.kitco.com]](http://www.weblinks247.com/indexes/idx24_usd_en_2.gif)
![[Most Recent Quotes from www.kitco.com]](http://www.kitconet.com/images/live/s_silv.gif)