
Send this article to a friend:
January
25
2019

|
Send this article to a friend: January |
|
Copper Industry Carnage: The Worst Is Yet To Come
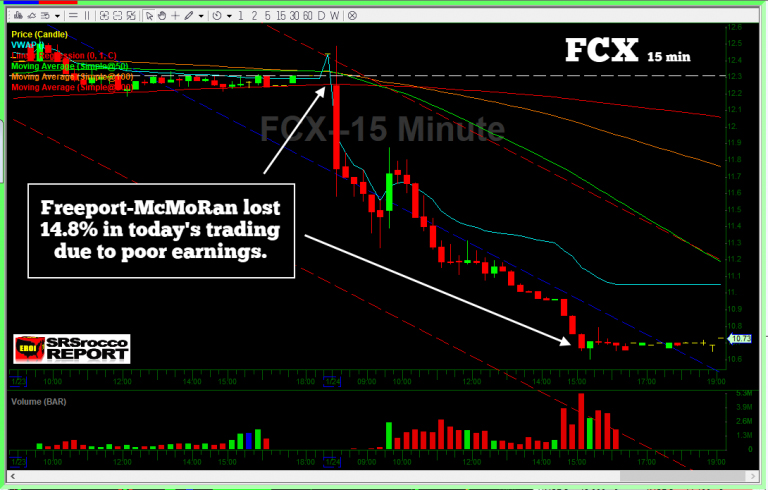
The large decline in net income was attributed to falling production, due to scheduled maintenance, and lower copper prices. Freeport-McMoRan’s stock price (FCX) started trading in premarket after releasing its dismal earnings at $12.30 a share, and by the time the closing bell rang, the stock fell to $10.70. FCX lost a $1.86 in one day:
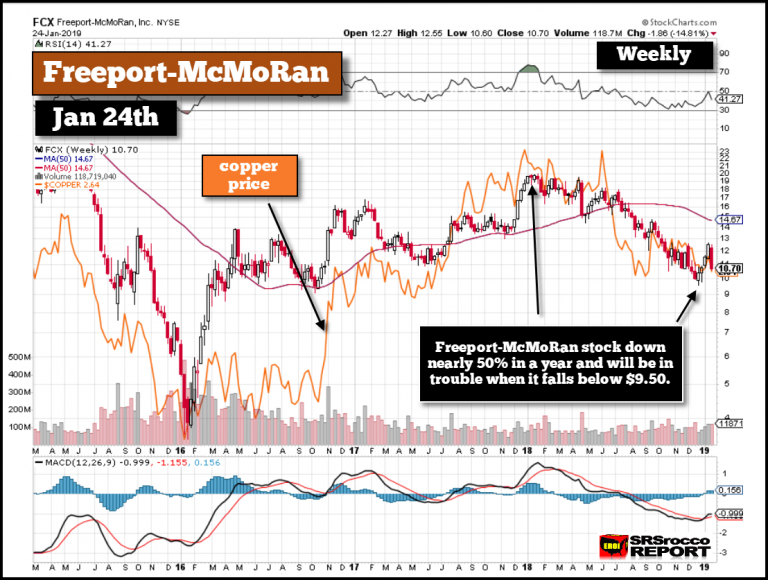
According to the company’s financial results, Freeport’s net income fell to $140 million Q4 2018 compared to $1.04 billion during the same period last year. While it’s true that the company’s poor results were due to a decline in production, another reason was the lower copper price which fell to an average of $2.75 in Q4 2018 versus $3.21 in the same quarter last year. The copper price was trading at a high of $3.30 at the beginning of 2018 but has now fallen by more than 20% to $2.64. The drop in the copper price over the past year has negatively impacted Freeport’s share price. FCX share price has fallen from nearly $20 in January 2018 to $10.70 as of the close on Thursday’s trading (Jan 24th).
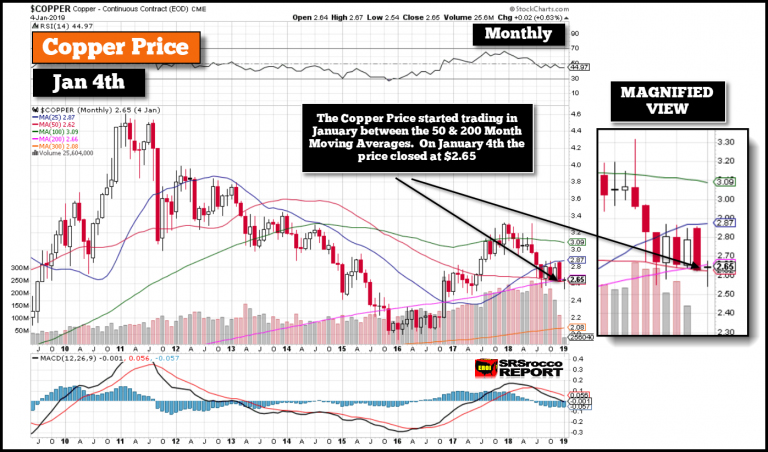
Freeport’s stock price is shown in the candlesticks while the copper price is shown in the orange line. I didn’t put a line in the chart, but if Freeport falls below the $9.50 level indicated by the arrow, it doesn’t have any support below it for quite a while. Unfortunately for Freeport, my analysis suggests that the copper price is getting ready to take the next stage lower along with the broader markets. As I mentioned weeks ago, the copper price was stuck between two moving averages and would likely stay there until it fell below it substantially. On January 4th, the copper price was trading at $2.65, in between the 50 & 200 Month Moving Averages (MMA):
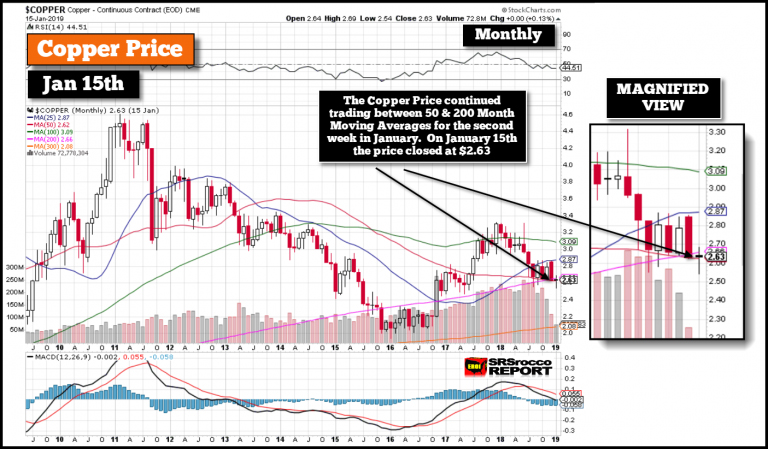
If you look at the magnified view, you can see the copper price positioned between the RED LINE (5o MMA) and the PINK LINE (200 MMA). Now, if we look at the copper chart on Jan 15th, see how much has changed:
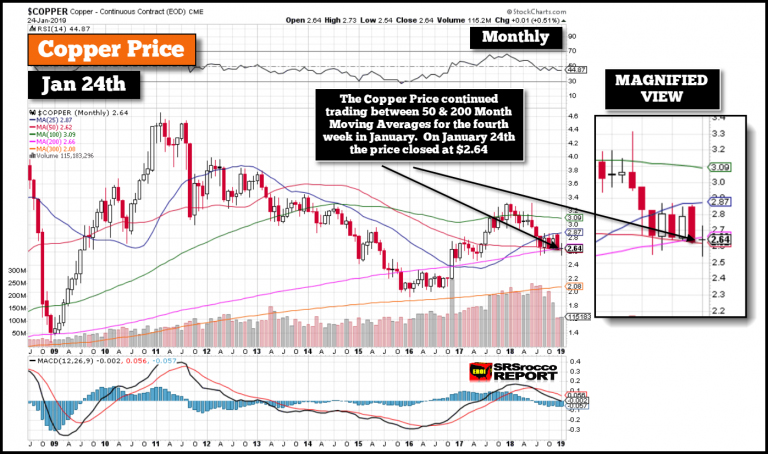
The copper price was at $2.63 but was still stuck between the moving averages nearly ten days later. While the copper price trades up and down during the day, it continues to close between the moving averages. So, let’s look at the most recent copper chart done today. Who wants to guess as to where the copper price closed today?
Well, look at that. The copper price is a penny more today than it was nearly ten days ago and it is still stuck between those moving averages. While the type of candlestick isn’t a rare formation, we can definitely see the tug-of-war going on in the trading pits. Also, this was the same setup with the oil chart in December before the price fell. Interestingly, the oil price only remained between the moving averages for a week before it headed lower. However, the copper price continues to trade in the same place for nearly four weeks. I believe the reason the copper price hasn’t fallen yet has to do with the strength of the broader markets as they recovered from their lows on Christmas Eve. The copper price will likely begin its next stage lower along with the broader markets within the next week or so. The carnage in the copper industry has only begun. If the copper price falls below the $2.08 level (300 MMA Orange line), shown in the chart above, then it can get very ugly for the copper mining companies who are just beginning to feel the pain. If you are new to the SRSrocco Report, please consider subscribing to my: SRSrocco Report Youtube Channel.
So please consider supporting my work on Patron by clicking the image below:
Or you can go to my new Membership page by clicking the image below:
Check back for new articles and updates at the SRSrocco Report. You can also follow us on Twitter, Facebook, and Youtube below:
|
Send this article to a friend:
 |
 |
 |


![[Most Recent Quotes from www.kitco.com]](http://www.kitconet.com/charts/metals/gold/t24_au_en_usoz_2.gif)
![[Most Recent USD from www.kitco.com]](http://www.weblinks247.com/indexes/idx24_usd_en_2.gif)
![[Most Recent Quotes from www.kitco.com]](http://www.kitconet.com/charts/metals/silver/t24_ag_en_usoz_2.gif)