
Send this article to a friend:
January
23
2018

|
Send this article to a friend: January |
|
According To These 3 Measures The Stock Market Is Now Literally Off The Charts
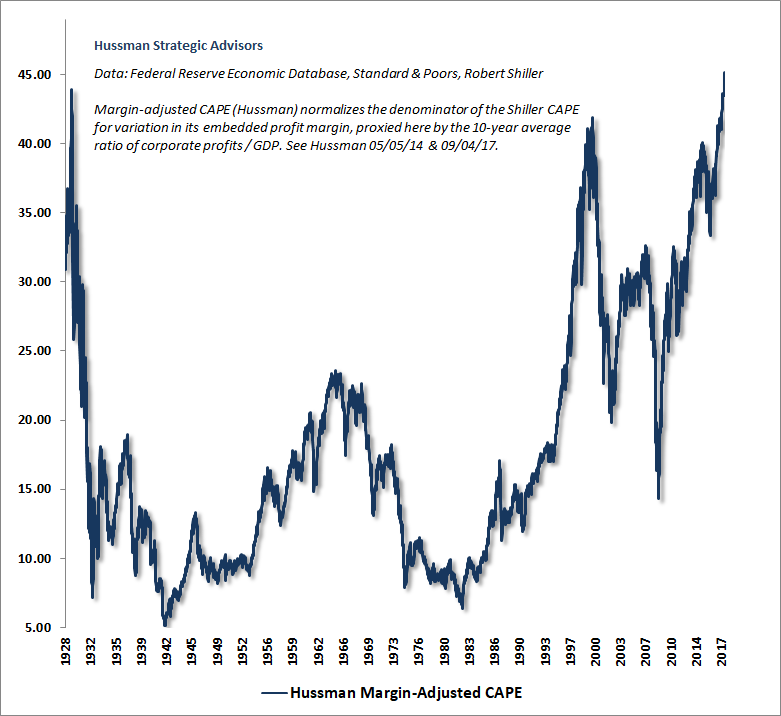
The first chart comes from my friend, John Hussman, and shows his margin-adjusted version of the cyclically-adjusted price-to-earnings ratio. This improved version of the CAPE ratio (improved because it has a greater negative correlation with future 12-year returns) shows equity valuations have now surpassed both the dotcom mania peak in 2000 and the 1929 mania peak.
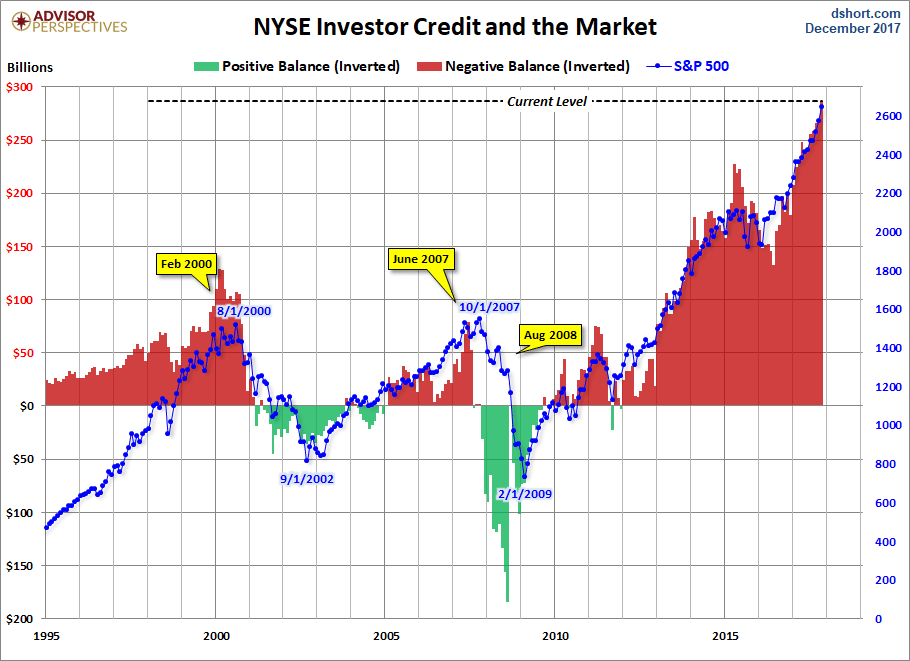
This next chart, from Doug Short, shows that investors today are employing more leverage than ever before. Even when you adjust margin debt for the overall size of the economy it’s at a new record high and, to my knowledge, this doesn’t include the asset-backed loans at major financial firms which have become so popular in recent years.
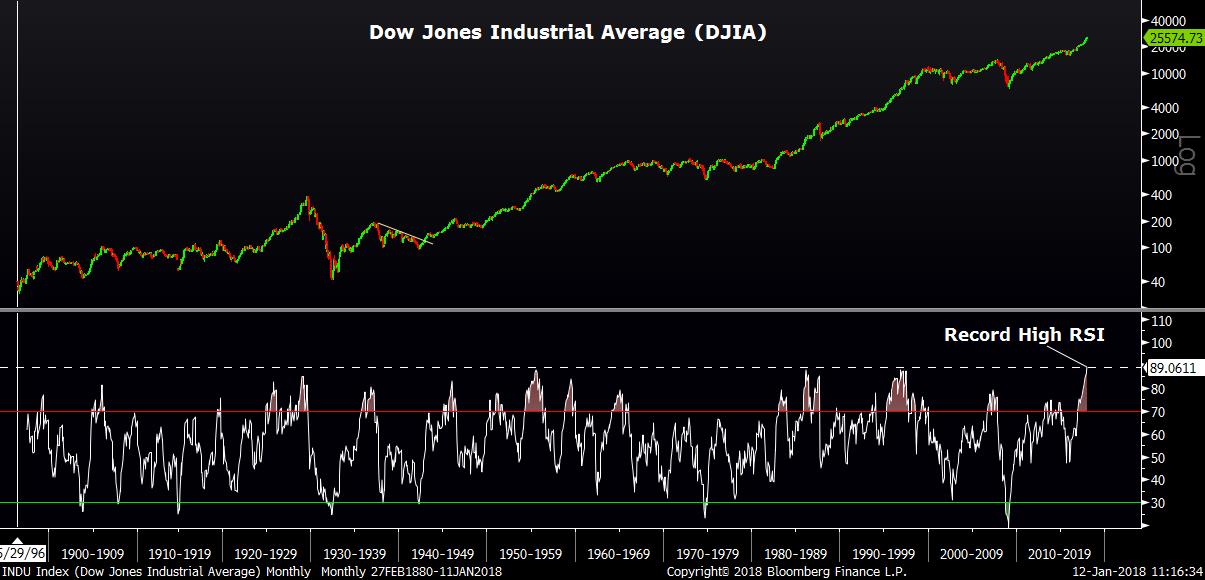
Finally, from a technical standpoint, the monthly RSI reading of the Dow Jones Industrial Average shows the stock market is now more overbought than at any other time during the entire history of this index which was created way back in 1896 (chart via Nasdaq.com).
Thus it is fair to say that this is now the most overvalued, overbullish and overbought stock market of all time.
|
Send this article to a friend:
 |
 |
 |


![[Most Recent Quotes from www.kitco.com]](http://www.kitconet.com/charts/metals/gold/t24_au_en_usoz_2.gif)
![[Most Recent USD from www.kitco.com]](http://www.weblinks247.com/indexes/idx24_usd_en_2.gif)
![[Most Recent Quotes from www.kitco.com]](http://www.kitconet.com/charts/metals/silver/t24_ag_en_usoz_2.gif)