Send this article to a friend:
January
12
2016

|
Send this article to a friend: January |
|
IT’S TRUE…. The U.S. Peaked In Silver Production
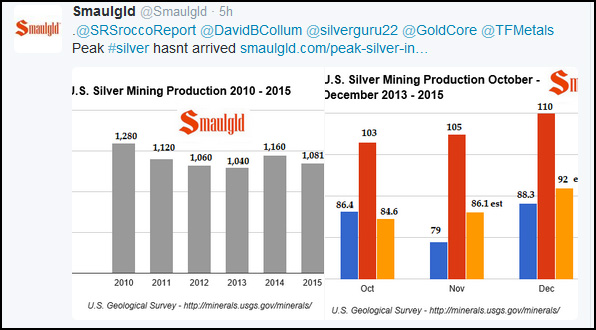
In my recent article, U.S. Silver Production Drops Significantly Again In October… Has Peak Silver Arrived?, I wrote about the recent steep drop in U.S. silver production and how this was a likely trend for many countries in the future . I also stated that if the global economy went into the toilet in 2016, then I believe Peak Silver is already here. I had some interesting emails and tweets in response to this subject. Our friends at Smaulgld replied with the following tweet:
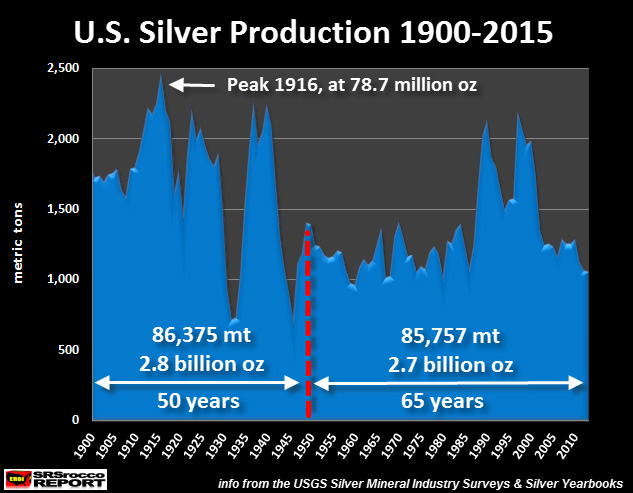
As you can see, Smaulgld responded by saying,“Peak #Silver hasn’t arrived.” While the folks at Smaulgld have put out some excellent work on the precious metal industry as of late, their recent response wasn’t one of them. However, we thank them for the effort and motivation to set the record straight on this issue. First… I wasn’t implying that “Peak silver” had possibly arrived in the United States, rather I was referring to Global silver production. Why? Because anyone who has studied history, knows the United States peaked in silver production 100 years ago. I just put together this chart showing U.S. silver production from 1900-2015:
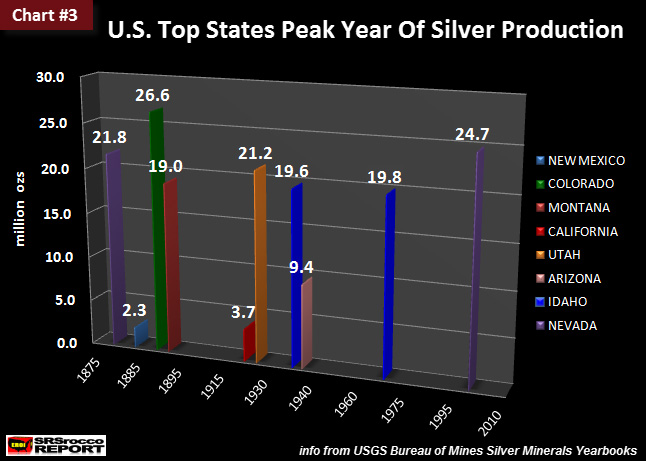
As we can see from the USGS data, the U.S. peaked in silver production in 1916 at nearly 2,500 metric tons. This turns out to be a hefty 78.7 million oz (Moz). Not only did the United States peak in silver production a century ago, more silver was mined from 1900-1950 than from 1950-2015. In the first 50 year time span (1900-1950), the United States produced 2.8 billion oz versus 2.7 billion oz in the second 65 year segment (1950-2015). Basically, the United States produced its high-quality, high volume silver a LONG TIME AGO. Second….. the majority of the top eight states had peak silver production back in the late 1800’s and early 1900’s. Here is Chart#3 (of 48 charts) from my THE SILVER CHART REPORT. It shows the peak year of silver production for each state:
Here we can see that three of the states (New Mexico, Colorado & Montana) peaked before 1900 and three more (California, Utah & Arizona) peaked before 1940. Amazingly, Colorado produced 26.6 Moz of silver in one year (1892), with only human-animal labor utilizing low-tech picks and shovels . On the other hand, there are two different peaks for Nevada and Idaho showing how modern technology impacted production in these two states. Regardless, most of the high-quality, high volume silver production from these states was produced prior to 1940. So the “Glory Days’ of U.S. silver production are over.. and over for good. According to the USGS, the United States only has 25,000 mt of silver in reserve. That’s about 804 Moz. However, I doubt a significant percentage of these reserves will ever be extracted. As we can see, current U.S. silver production of 1,080 mt (34.7 Moz) is well off its peak of 78.7 Moz from 100 years ago. The U.S. did have a recent surge of silver production in 1997 at 2,180 mt (70 Moz), but this was due to two reasons:
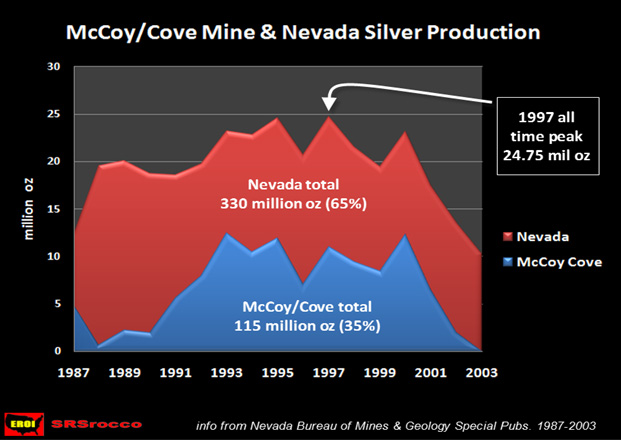
Here is a chart showing the McCoy-Cove Gold-Silver Mine and Nevada silver production:
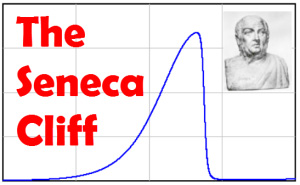
The McCoy-Cove Mine peaked in silver production in 1993 at 12.5 Moz. This was nearly 25% of total U.S. silver production that year. Nevada peaked in silver production at 24.7 Moz in 1997 and is forecasted to produce 9.5 Moz in 2015. Even though we could see some growth in Nevada silver production going forward, it’s unlikely to surpass its record set in 1997. Lastly, as I mentioned in my previous article linked at the top of the page, it’s becoming increasingly difficult for the world’s Central Banks to continue servicing the massive debt on their books currently. This is precisely why the United States and many other countries have had ultra-low or zero interest rate policies. The only way to continue growth is to add a larger percentage of debt… but this is now becoming impossible. Thus, the collapse comes as ancient Roman Philosopher Lucius Seneca described over 2,000 years ago.
As Seneca states…. increases are of sluggish growth, but the way to ruin in rapid. 2016 looks like it could turn out to be one hell of a year. It will be interesting to see just how well the world’s paper assets survive the forces of Seneca’s Cliff.
|
|---|
Send this article to a friend:
 |
 |
 |
 There continues to be a lot of misinformation on the internet, even on the alternative media. So, I thought I set the record straight. Yes, it’s true…. the facts show that the U.S. peaked in silver production a century ago. That’s correct, 100 years ago.