
Send this article to a friend:
December
20
2016

|
Send this article to a friend: December |
|
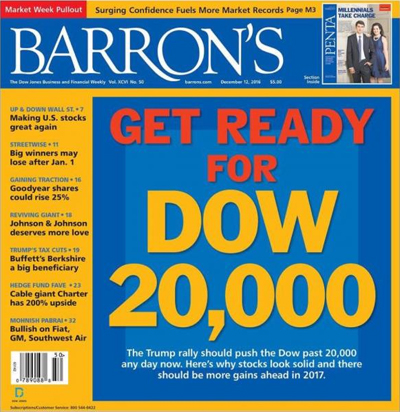
A New Dow High – Anyone Concerned?
Official U. S. national debt is approximately $20 trillion as of December 2016, and has approximately doubled every 8 years at a 9% compounded rate for over a century.
DEBT HIGHER – S&P HIGHER Examine this 27 year graph of official national debt and the S&P 500 index, both on log scales. They increase together. Debt increases, more dollars surge through the economy and those dollars are plugged into stocks, bonds, and higher consumer prices.
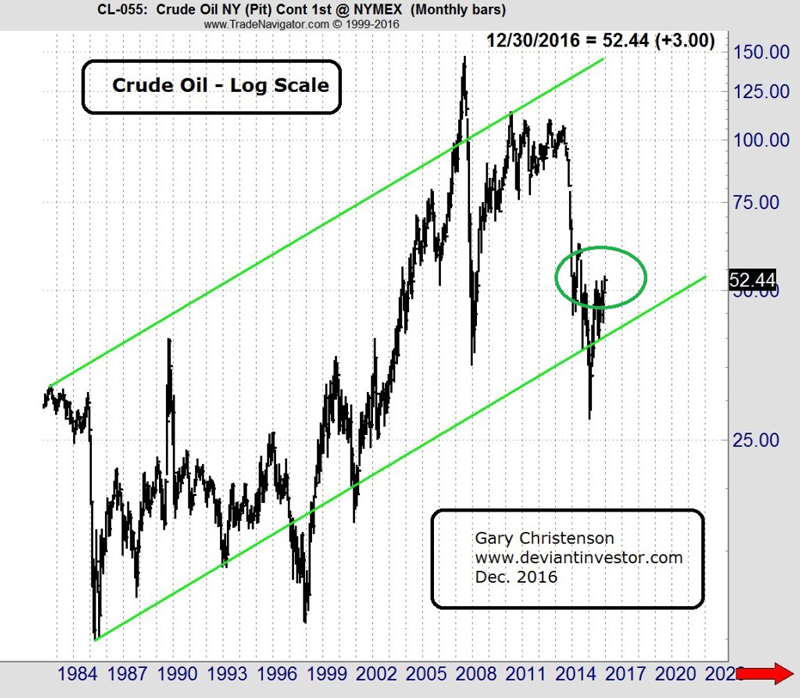
Examine this three decade chart of crude oil on a log scale. Prices increase exponentially and are near the bottom of the range as drawn.
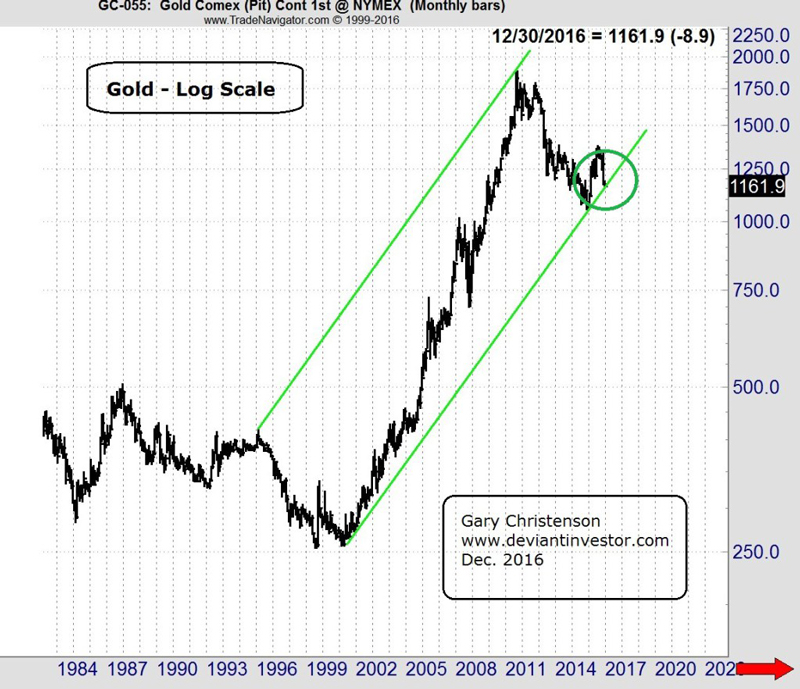
Examine this three decade chart of gold on a log scale. Prices increase exponentially and are near the bottom of the range as drawn.
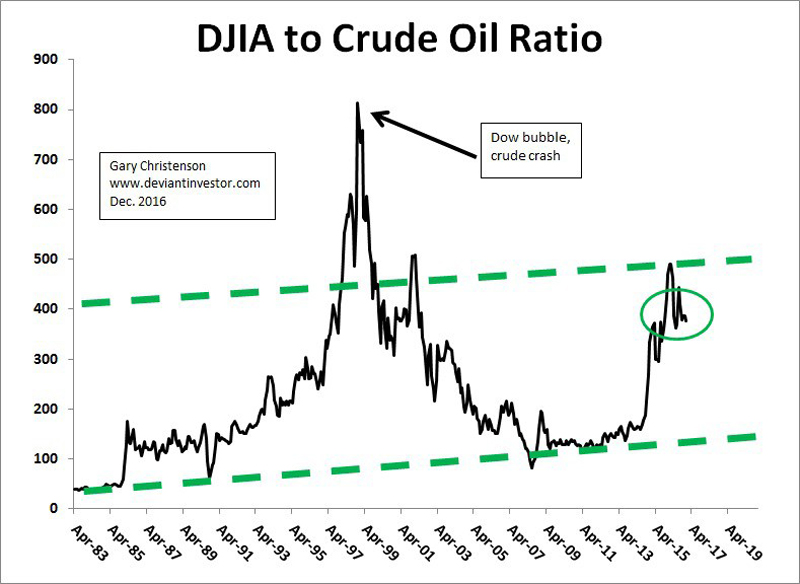
Examine this three decade chart of the ratio of the Dow to Crude Oil. The ratio is near the high end of the range. A correction back to the lower trend channel suggests higher crude oil prices and/or lower Dow. Because the U.S. stock market is overvalued by any number of measures involving price, earnings, book value, ratio to GDP and more, my expectation is the Dow will decline in 2017.
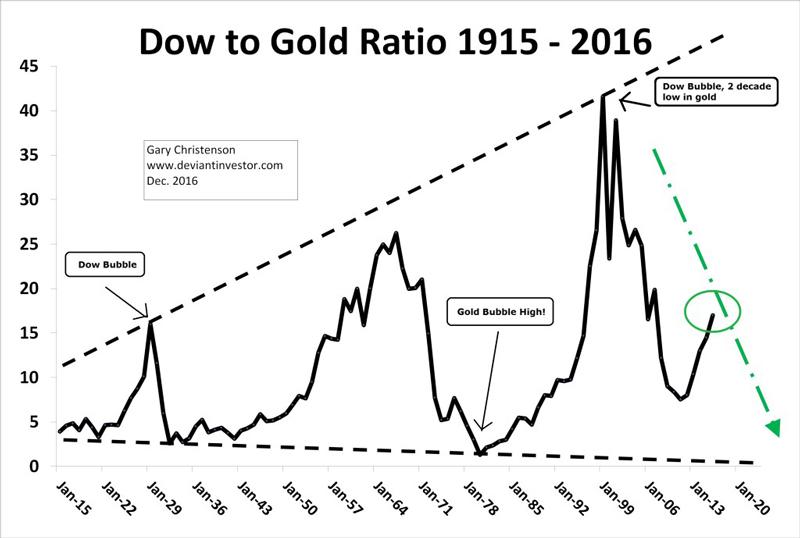
Examine this 100 year chart of the ratio of the Dow to gold. Global debt growth is outrageous and clearly out of control, central banks overtly encourage consumer price inflation, bond monetization and QE have become normal, the Dow sits at all-time highs and gold has fallen 40% from its highs, the reasonable expectation is the price of gold will rally substantially, and probably the Dow will correct in 2017.
CONCLUSIONS
DISCLOSURE (sarcasm) This article was not influenced by supposed Russian hackers, CIA leaks, John Podesta emails, or “fake news” reported by the NY Times or Zerohedge about democrats, republicans, HRC or Trump. Read Karl Denninger on Russian Hacking Gary Christenson | The Deviant Investor
|
Send this article to a friend:
 |
 |
 |
 While the global bond markets have begun to correct their 35 year bull market, the major U.S. stock indices, including the Dow, NASDAQ, Russell and S&P, have rallied nicely.
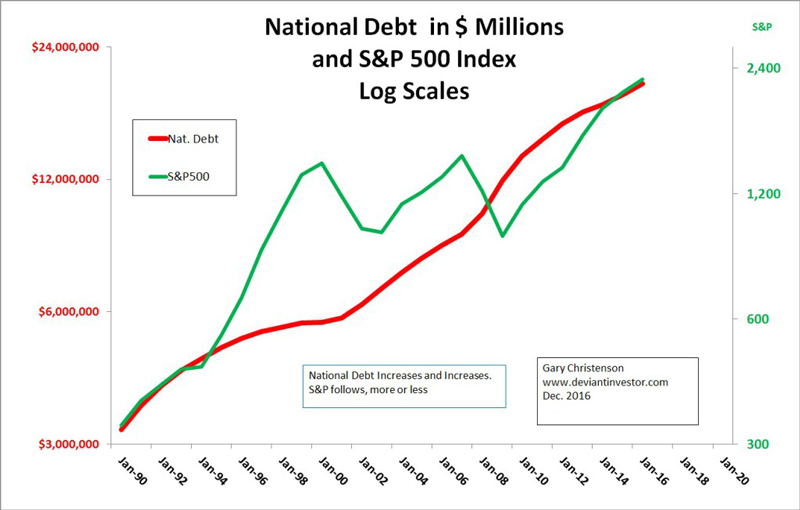

![[Most Recent Quotes from www.kitco.com]](http://www.kitconet.com/charts/metals/gold/t24_au_en_usoz_2.gif)
![[Most Recent USD from www.kitco.com]](http://www.weblinks247.com/indexes/idx24_usd_en_2.gif)
![[Most Recent Quotes from www.kitco.com]](http://www.kitconet.com/charts/metals/silver/t24_ag_en_usoz_2.gif)