Send this article to a friend:
December
13
2014

|
Send this article to a friend: December |
|
Wall Street, aka United States, Pulls Off Another Destructive Coup
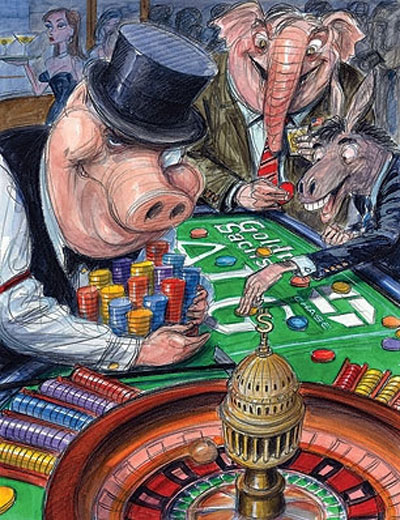
There is no room for sanity in the United States, anymore, and the public is sleepwalking through it all. Arguably, this has been carefully orchestrated by the elites over the past century, as in 100 years and not just in the past decade or so. Capitalism is dead in the US, and has been for decades. Ironically, China and Russia are far more capitalistic. Once the elites took over the money supply, with the passage of the Federal Reserve Act in 1913, there was a concerted effort to take over all media and start a propaganda scheme that is far superior than any other country in effective population control. What did Wall Street just do? It guaranteed that any losses from all derivatives that arise within the bankrupt banking system will be passed onto the taxpaying serfs called United States citizens. When Congress just passed its bill allowing the [bankrupt] government to keep spending with abandon, attached to the bill was a portion written by Citicorp that allows financial institutions [read that as Wall Street banks] to trade in certain derivatives that are insured by the FDIC. What it means is that taxpayers will be responsible for all losses resulting from theses derivative contracts. The US debt is now at $16+ trillion dollars, thanks to “I-will-cut-the-deficit-in-half-if- you-elect-me Obama.” Trillion dollar deficits were unheard of before Obama was elected. What is the potential loss exposure by these bank’s derivative gamblings? $300+ trillion. The banker-caused crash of 2008/09 was nothing when compared to what will happen when these risky derivative deals fall apart, as they will. With losses socialized, there is no incentive for bankers to be careful in crafting their derivative deals that are created solely for the purpose of generating huge fees for them. If a deal happens to work out, it will have been by accident. How much insurance is there within the FDIC [Federal Deposit Insurance Corp]? About $25 billion: $25,000,000,000. How much in deposits are there in US commercial banks? About $9,300+ billion: $9,300,000,000,000. One more time: what is the derivative risk exposure now written into law” $300+ trillion: $300,000,000,000,000. When the banks lose on their derivatives, and after allowing for $25 billion in FDIC insurance, the public now is on the hook for the remaining $299,975,000,000,000. This makes the current deficit of $16 trillion look more like petty cash. Where is the public outrage over this? The short answer: There is none. This is on top of yet another non-public outrage announced at the end of the G20 meeting in Brisbane, back on 16 November. Legislation is to be written that all bank deposits, [hint: this means anyone having any of their money held by a bank] are considered a part of a commercial bank’s capital structure. If there is a bank failure, the “value” of deposits within a failed bank will decline in line with the bank’s failure. In other words, large-scale depositors will find themselves in the BK court system for years before the bankruptcy court makes a final determination as to the scope of any depositor’s losses. What was once called a “deposit” is now just a “part of the bank’s capital structure,’ as in “It ain’t your money any more, Fool.” Where is the public outrage over this? See above the last paragraph. Now US banks are telling depositors that they will be assessed a fee for keeping deposits in banks. The banking system as it was initially set up in this country no longer exists. It used to be said of gold by bankers [and still is], that it does not pay any interest. Well, with certain banks, that now holds true for “cash.” [Four legs good, two legs bad.”] How does this relate to silver and gold? Neither have any counter-party risk. An ounce of gold or silver will always be the same ounce. The only factor that will change is how that ounce is “valued” by a different medium of exchange, almost always some form of fiat that has no intrinsic worth. The insanity of ongoing central bank suppression of gold and silver to levels that defy the unprecedented demand world-wide will come to an end, which always comes back to the “When” factor. When it happens and not a day before, is the best answer we know. Gold just took a turn for the positive, at least for now, when last week’s rally went above the broken support of the 1180 area and held. We tend to be on the opposite end of the spectrum for making a “call” on the gold and silver markets. Most others want to be first to say PMs are going to rally and have their market call be timely, but their timed “call” is usually one that has been made on several previous occasions. Our take on the market comes from the market itself, and unless a bottom has been confirmed, and none has since the highs of a few years ago, then we get to deal with what is. Unlike Clinton who said, “It depends on what the definition of ‘is’ is,” our definition is confirmation. There is a potential for gold to be forming a bottom, based on the explanation provided on the chart below, but there are a few steps that must be met before anyone can say, “The bottom is in.” If these simple but important steps are not met, then there is the likelihood that yet another low can occur. “ESF” on the chart refers to the Exchange Stabilization Fund, ironically.
If you look at the weekly and the daily chart you will continue to see a series of lower highs and lower lows. We have yet to see any definition that incorporates that kind of activity to define an up trend. The current rally in gold has not yet surpassed the mid-October swing high. What to look for in order to say the daily trend is up [which may not necessarily change the higher time frame weekly chart]? Gold needs to demonstrate stronger EUM [Ease of Upward Movement], evidenced by wider range bars with strong closes and increased volume. Call that part 1. Part 2 consists of a market correction that shows a weak reaction in the form of smaller ranges, positive closes, and decreased volume, indicating selling has dried up. Part 2 is what confirms part 1 that enables one to say with more authority that a trend change has taken place. If the part 2 correction takes the form of wide range bars [showing ease of movement], closes on the lower part of the range, and increased volume, either a new low can occur, or it is a sign that price has more work to do before turning stronger, and being long could prove costly.
Despite silver’s chart structure being much weaker than gold’s, and it requiring a lot more effort to change its down trend, silver has been performing slightly better than gold, using the gold/silver ratio as a gauge. It is presently just under 72:1 where in recent weeks it had been consistently running between 73:1 and 75:1. With that observation, nothing much further can be added until the chart structure improves.
The immediate band of resistance from October will provide important feedback by the manner in which silver negotiates it. A strong rally above 18, followed by a weak correction would go a long way to improve the odds favorably for silver. Until some more visible sign[s] of strength enters this market, it will continue to meander. Beyond the chart reads, we remain staunch advocates for buying and holding either or both metals. The criminal enterprise federal government has clearly demonstrated that the American people are the enemy, and that began by declaration from FDR back in the 1930s when the Trading With The Enemy Act made US citizens enemy of the State. To trust anything other than gold and silver against the federal government’s actions that clearly demonstrate the bankers are in charge is pure folly, plain and simple.
|
|---|
Send this article to a friend:
 |
 |
 |