Send this article to a friend:
November
8
2013

|
Send this article to a friend: November |
|
Two Major Trends Of The 21st Century Are Reversing
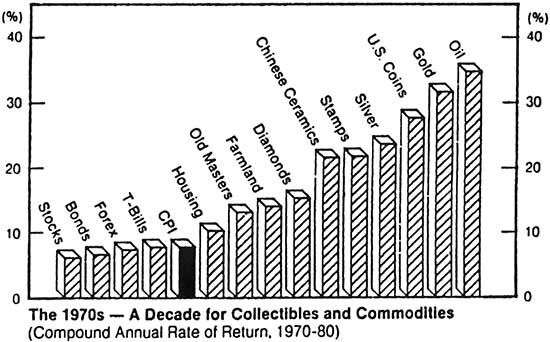
It's no wonder that Huntington Beach inspired this nickname. It has stuck because one of the favorite fun activities here is watching surfers try to identify the perfect wave and ride it all the way to the shore. As an investor, I try to do the same: identify a major trend and ride it as long as it lasts. "Surf City" was co-written in the '60s by the Beach Boys' lead songwriter, Brian Wilson, and I hear it frequently in stores and restaurants even today. While the soundtrack is still the same, the markets are in a transition year. And to fully understand the scope of what's coming, today let's "fast-forward" to the '70s. We'll look at the investment trends throughout the past 40 years … and how two key trends are reversing to produce the next wave of change that investors can already start to surf! In the 1970s, "real" assets were the major investment trend.
As you see in the chart, stocks and bonds did poorly and tangible assets like gold and oil did extremely well. The oil embargo and oil supply disruptions pushed inflation higher. Investors responded by moving into inflation hedges like those real assets. The following decades brought different investment trends.
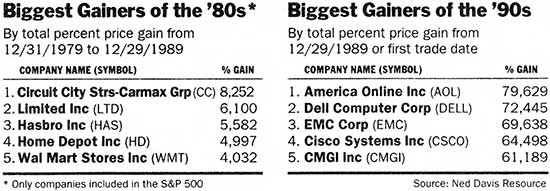
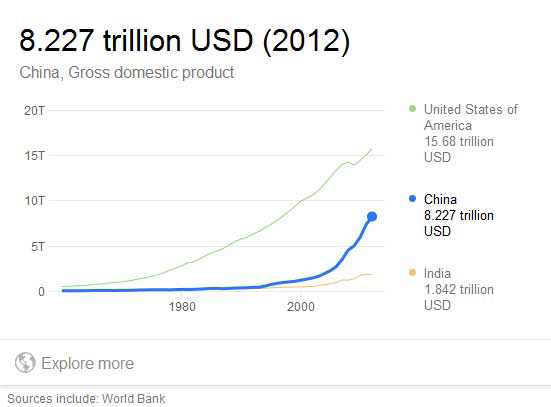
In the 1980s, consumer stocks were hot as baby boomers started their families and became a major economic force. Before 1970, hardly anybody had heard of Wal-Mart (WMT) or Home Depot (HD). Of course, in the 1990s it was the technology boom. Many tech stocks had spectacular gains. In the 2000s, the major economic trends were China and the global financial crisis. China's growth and global central bank stimulus programs caused a repeat of the 1970s, making natural resources and real assets the preferred investments. Now I see many signs that these two trends are reversing. China has been a major trend for the 21st century. The country's economic growth has been unprecedented. China has grown from nowhere to about half the GDP of the U.S.
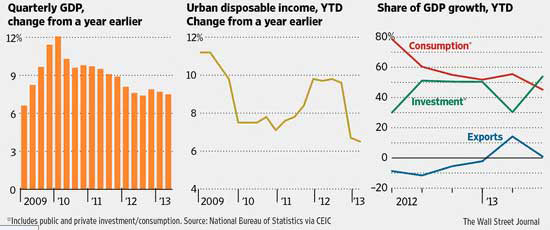
Manufacturing, government infrastructure spending, and real estate development drove China's amazing growth. Now China's economic story is in transition. Growth is slowing and the government is trying to shift from a manufacturing and export-driven economy to a consumer-driven economy, like the U.S. and Japan. The U.S. economy is about 70% consumer-driven. Below are the current trends for China:
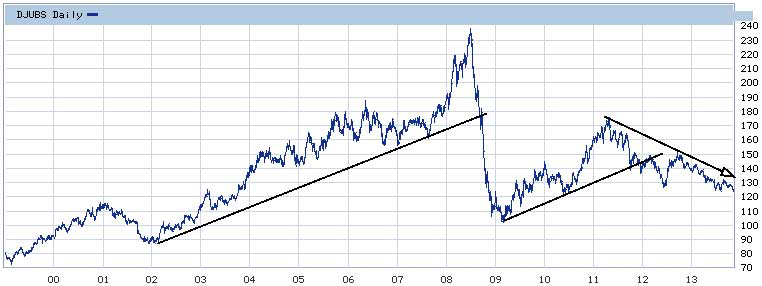
With growth rates slowing, the law of large numbers will make it harder for China to keep its previous pace. The charts show that China's transition to a consumer economy is not going well. China does not have the safety nets we enjoy in the U.S., so Chinese citizens tend to save a lot more money. They often want to invest their savings in real estate. The Chinese economic slowdown and transition to a consumption economy has caused a reversal in commodity prices. China is not buying as much iron ore, copper, lumber and other materials as it did in the past. Look at this 15-year chart of the Dow Jones Commodity Futures Index:
Let's review the chart:
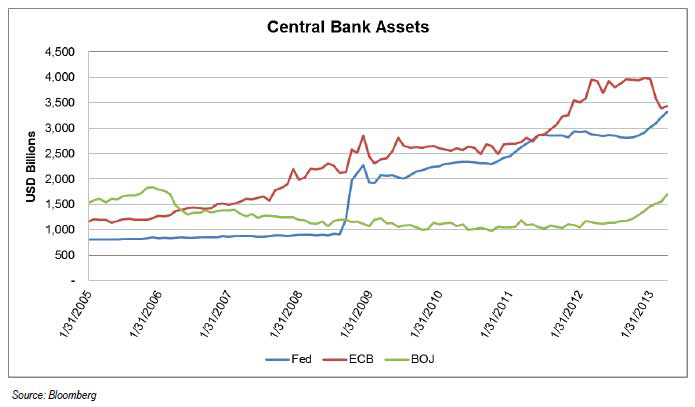
U.S. Fed and Global Central Bank Money-Printing After the financial crisis, investors moved into safe-haven investments like gold and U.S. Treasury bills. At the same time, global central banks pumped more than $10 trillion into the global economy to help stimulate growth. This chart shows how the U.S., Japanese and European central banks expanded their balance sheets.
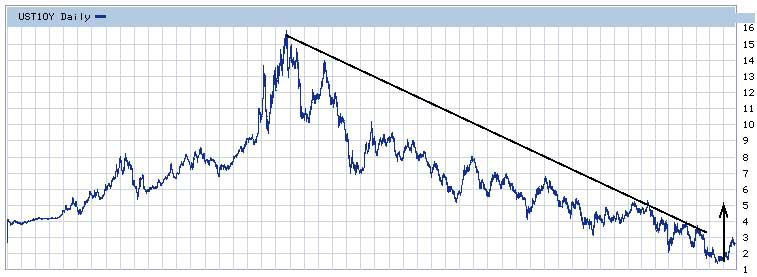
The money printing also reduced the value of the dollar, the euro and Japanese yen. This currency debasement caused investors to hedge their currency holdings with gold. This year the U.S. Fed has been considering ending its money printing. The result is a reversal of the flight to safety and hedging trends. Interest Rates Below is a long-term chart for the 10-year Treasury note:
Interest rates have been falling since the early 2000s, and bottomed last year at historic lows. This year rates began to move up in anticipation that the Federal Reserve would "taper" or end its QE3 stimulus program. This means the Fed may stop printing money and cease buying U.S. government debt. Investors piled into gold for the following reasons:
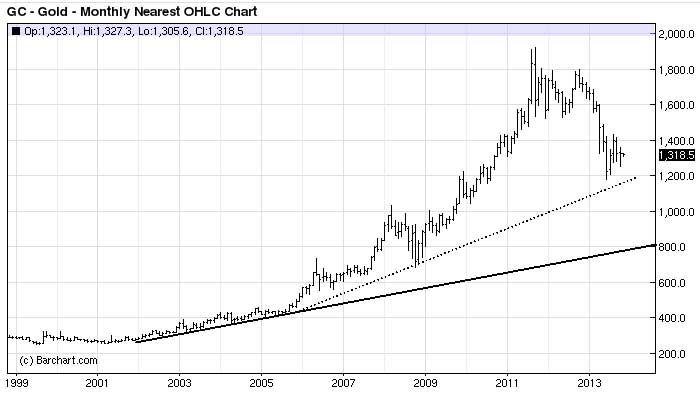
As the long-term gold chart shows, even though gold is down about 30% from its 2011 peak, the trend is still bullish. Gold would have to break below $800 to end the long-term bull market. Prices are well above the trend lines. Remember, the cost to produce gold is about $1100 per ounce. Gold probably would not stay long below $1,100 because producers would cut production. I believe gold will probably trade in a trading range for the near future. Investors and central banks still need gold:
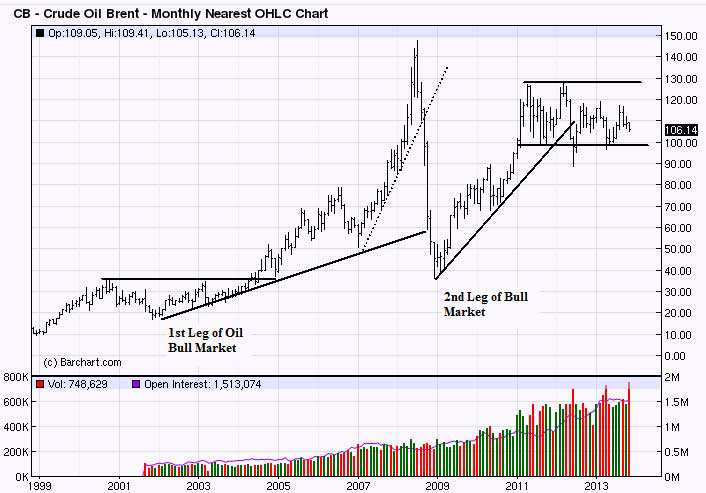
Oil As I wrote on Oct. 2, oil is essential to the global economy. It fuels most of the world's cars, trucks, planes and boats. Because it is so essential, oil prices have stayed elevated. Here is a current chart for Brent crude:
Let's review the chart:
Bottom Line The two major trends of the 21st century are reversing:
Investors are responding with a switch from safe havens like gold and bonds to riskier assets like equities. Despite the transition, gold and oil remain in bull markets.  This article is brought to you courtesy of Dan Hassey Uncommon Wisdom Daily is a free daily investment newsletter published by Weiss Research, Inc. This publication does not provide individual, customized investment or trading advice. All information is based upon data whose accuracy is deemed reliable, but not guaranteed. Performance returns cited are derived from our best estimates, but hypothetical as we do not track actual prices of customer purchases and sales. We cannot guarantee the accuracy of third party advertisements or sponsors, and these ads do not necessarily express the viewpoints of Uncommon Wisdom Daily or its editors.
|
|---|
Send this article to a friend:
 |
 |
 |
 I live in Southern California, in the city that inspired Jan & Dean's hit "Surf City."