
Send this article to a friend:
May
11
2017

|
Send this article to a friend: May |
|
Key Economic Data Reveals A Recession Has Begun
Auto sales in April declined again, with the Big Three domestic OEMs (GM, F and Chrysler) missing Wall St estimates by a country mile. The manipulated SAAR (seasonally adjusted annualize rate) metric put a thin layer of lipstick on the pig by showing a small gain in sales from March to April. But this is statistical sleight of hand. The year over year actuals for April don’t lie: GM -5.7%, F -7% and Chrysler -7.1%. What is unknown is to what extent the numbers reported as “sales” were nothing more than cars being shipped from OEM factory floors to dealer inventory, where it will sit waiting for an end-user to take down a big subprime loan in order to use the car until it gets repossessed.
The growth in loan origination to the key areas of the economy – real estate, general commercial business and the consumer – is plunging. This is due to lack of demand for new loans, not banks tightening credit. If anything, credit is getting “looser,” especially for mortgages. Since the Fed’s quantitative easing and near-zero interest rate policy took hold of yields, bank interest income – the spread on loans earned by banks (net interest margin) – has been historically low. Loan origination fees have been one of the primary drivers of bank cash flow and income generation. Those four graphs above show that the loan origination “punch bowl” is becoming empty. HOWEVER, the Fed’s tiny interest rate hikes are not the culprit. Loan origination growth is dropping like rock off a cliff because consumers largely are “tapped out” of their capacity to assume more debt and, with corporate debt at all-time highs, business demand for loans is falling off quickly. The latter issue is being driven by a lack of new business expansion opportunities caused by a fall-off in consumer spending. If loan origination continues to fall off like this, and it likely will, bank earnings will plunge. But it gets worse. As the economy falls further into a recession, banks will get hit with a double-whammy. Their interest and lending fee income will decline and, as businesses and consumers increasingly default on their loans, they will be forced to write-down the loans they hold on their balance sheet. 2008 all over again. Because of this, I think Goldman Sachs (GS) makes a great short idea, although I don’t want to suggest timing strategies. It’s an idea that, in my view, you need to short a little at a time and add to it if the stock moves against you. I could also be a good “crash put” idea.
Goldman will be hit by a fall-off in loan demand and by a big drop in the fees from securitizing the loans it underwrites into asset-backed securities (ABS). In addition, GS facea an even bigger drop in the fees from structuring and selling OTC “hedge” derivatives to the buyers of Goldman-underwritten loans and ABS. Goldman’s net interest income has declined over the last three years from $4.1 billion in 2014 to $2.6 billion in 2016. This is a 36.5% drop. To give you an idea of the degree to which bank net interest income has dropped since the “great financial crisis,” in its Fiscal Year 2009, Goldman’s net interest income was $7.4 billion. That’s a 64% drop over the time period. In FY 2009, Goldman’s net income was $12.2 billion. In 2016, GS’ net income was $7.1 billion, as 42% decline. To give you an idea of how overvalued GS stock is right now, consider this: At the end of GS’ FY 2007, 6 months before the “great financial crisis” (i.e. the de facto banking system collapse), Goldman’s p/e ratio was 9.5x. At the end of its FY 2009, its p/e ratio was 6.9x. It’s current p/e ratio 13.5x. And the factors driving Goldman’s business model, other than Federal Reserve and Government support, are declining precipitously.
As for derivatives…On its 2016 10-K, Goldman is showing a “notional” amount of $41 trillion in derivatives in the footnotes to its financials. This represents the sum of the gross long and short derivative contracts for which Goldman has underwritten. Out of this amount, after netting longs, shorts and alleged hedges, Goldman includes the $53 billion in “net” derivatives exposure as part of its “financial instruments” on the asset side of its balance sheet. Goldman’s book value is $86 billion. If Goldman and its accountants are wrong by just 1% on Goldman’s “net” derivatives exposure, Goldman’s net derivatives exposure would increase to $94 billion – enough to wipe out Goldman’s book value in a downside market accident (like 2008). If Goldman and its “quants” have mis-judged the risk exposure Goldman faces on the $41 trillion in gross notional amount of derivatives to which Goldman is involved by a factor of 10%, which is still below the degree to which GS underestimated its derivatives exposure in 2008, it’s lights out for Goldman and its shareholders. Think about that for a moment. We saw how wrong hedge accounting was in 2008 when Goldman’s derivative exposure to just AIG was enough to wipe Goldman off the Wall Street map had the Government not bailed out the banks. I would bet any amount of money that Goldman’s internal risk managers and its accountants are off by significantly more than 1%. That 1% doesn’t even account for the “fudge” factor of each individual trading desk hiding positions or misrepresenting the value of hedges – BOTH crimes of which I witnessed personally when I was a bond trader in the 1990’s. As you can see in the 1-yr daily graph above, GS stock hit an all-time high on March 1st and has dropped 12.5% since then. I marked what appears to be a possible “double top” formation. The graph just looks bearish and it appears Goldman’s stock is headed for its 200 dma (red line,$202 as of Friday). To save space, I didn’t show the RSI or MACD, both of which indicate that GS stock is technically oversold.
Dave Kranzler spent many years working in various analytic jobs and trading on Wall Street. For nine of those years, he traded junk bonds for Bankers Trust. He earned a master’s degree in business administration from the University of Chicago, with a concentration in accounting and finance. Currently he co-manages Golden Returns Capital, a precious metals and mining stock investment fund based in Denver. He writes a blog and offers in-depth, unique research reports to help people understand and analyze what is really going on in our financial system and economy:
investmentresearchdynamics.com
|
Send this article to a friend:
 |
 |
 |
 Goldman Sachs’ net income declined 42% from 2009 to 2016. How many of you reading this were aware of that fact? Yet GS’ stock price closed today 36% above its 2009 year-end closing price. See below for details.
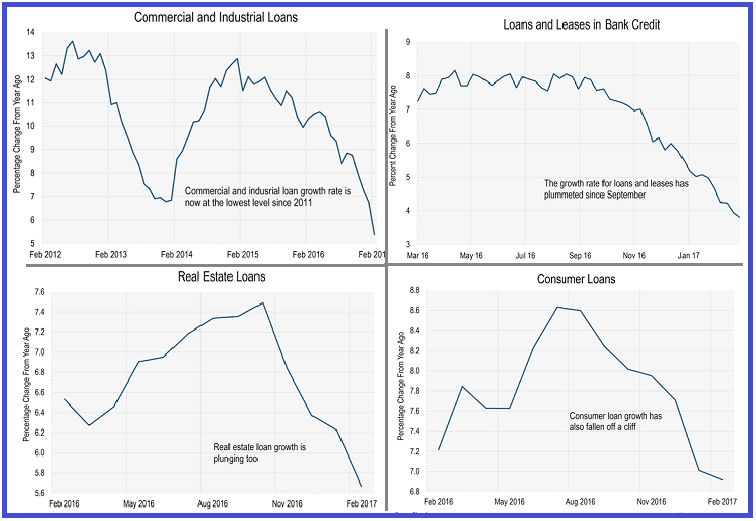


![[Most Recent Quotes from www.kitco.com]](http://www.kitconet.com/charts/metals/gold/t24_au_en_usoz_2.gif)
![[Most Recent USD from www.kitco.com]](http://www.weblinks247.com/indexes/idx24_usd_en_2.gif)
![[Most Recent Quotes from www.kitco.com]](http://www.kitconet.com/charts/metals/silver/t24_ag_en_usoz_2.gif)