April
04
2013
04
2013
|
April 04 2013 |
U.S. Mint Sales For March: U.S. On Pace To Use All Domestic Mine Production For Silver Eagles
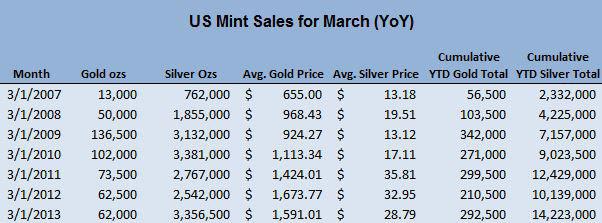
Analyzing the U.S. Mint Sales Numbers When analyzing sales numbers it is important that investors go past the headlines and dig deep into the true nature of the sales. For brevity we are only showing the last few years of sales, but for doing comparisons we have used data from the beginning of the current bull market in 2001. To start, let's take a look at the U.S. Mint sales numbers for silver and gold for March and compare them to the same month in previous years. We are doing a year-over-year comparison because coin sales are very seasonal in nature; to get a fair read we have to compare March to March.
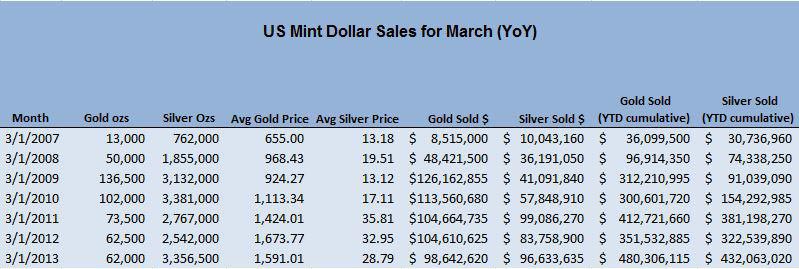
The first thing that stands out about the numbers is that silver eagle sales continue to be very strong with 3,356,500 ounces sold in March. This was the second largest amount ever sold in March, and the only March that surpassed this number was in 2010 - when silver prices were 40% lower. The year-to-date numbers continue to impress with 14 million silver ounces sold through March - which is 15% higher than the second highest month (March 2011). As a reminder, 2011 was the strongest year for silver eagle sales (and for the silver price) with 39 million silver eagles selling in 2011, and if we continue matching this sales pace, 2013 will be 15% higher than 2011 and reach 45 million silver eagles sold. To put these numbers in perspective, according to the U.S. Geological Society, the U.S. mined 1050 tons of silver in 2012 (or 33.6 million ounces). If sales maintain their pace of 45 million ounces of silver, the U.S. will use ALL of its mined silver to mint silver eagles and then have to import and additional 350 tons of silver (11.4 million ounces) simply to meet silver eagle demand - leaving no domestically mined silver for anything else. This is a very extraordinary situation! Gold eagle sales were relatively subdued with 62,000 ounces of gold eagles sold. Not particularly impressive but on the low side of average. Cumulative gold sales of 292,500 ounces were much better, with the third highest amount of year-to-date sales in the current bull market. On a dollar-basis these sales numbers are shown in the following table.
In the table above we have used the average monthly London price fix to calculate the dollar value of the month's bullion sales. Investors can see that monthly silver sales (in terms of the total dollar amount) have almost tied their record-high amount of $99 million dollars worth of sold silver in 2011 and were only $3 million (3% short) of the record-high dollar sold amount. But in terms of the year-to-date numbers, the $432 million dollars worth of sold silver are 15% higher than the previous high set in 2011 (the best year in silver since the 1980 high), and are continuing to impress. Not only are silver sales impressive, but gold sales year-to-date are also very impressive. With $480 million dollars worth of gold sold year-to-date, it is more than 15% higher than the previous high and that includes a lackluster March. Conclusion Based on the U.S. Mint sales numbers, physical gold and silver are being bought at an unprecedented level which, if the pace keeps up, will break both the gold and silver annual totals. Additionally, silver demand should use up all of mine supply, if it keeps up at this current rate, and should force the U.S. Mint to eat up additional silver supply to make up the difference. Investors have had a rough year investing in gold and silver and the strange divergence between the physical market and the paper market continues. This is an epic tug-of-war between investors, but we believe that the physical end will win as the physical and paper markets continue to duke it out for two reasons. First, physical silver investors are much "stickier" than paper investors because the investor buying $50,000 worth of silver eagles is less likely to sell if the price drops 2, 3, or 4 dollars - while the paper investors can buy and sell on a whim. This is essentially moving silver from weak hands to strong hands and when the paper investors come back into silver the market can reverse rather quickly. The second reason we believe that the physical investors will win the battle is that the physical market is ultimately what determines price when sales numbers get high enough. As we mentioned, if sales numbers continue then ALL of U.S. mined silver will be used to mint silver eagles and large amounts of silver will have to emerge from secondary sources simply to meet silver eagle demand. Paper markets can set the price short-term but as other users of silver find it harder to source the metal, you may see some interesting things happen in the paper market (and large jumps in price) as paper contracts are used as a way to deliver physical silver. SLV and PSLV investors be patient and make sure you buy some physical silver as a way to hedge your paper position. I'm an asset manager at Hebba Alternative Investments with a focus on real assets. In my articles I like to focus on events that affect the macro environment for assets (especially gold and silver), and also introduce readers to different metrics that I believe are under-utilized when assessing investments |
|---|
Send this article to a friend:
 |
 |
 |
 Pay Attention