Send this article to a friend:
January
06
2014

|
Send this article to a friend: January |
|
THE BIG QUESTION: Where Is The Price Of Silver Headed In 2014? 
Many precious metal investors would like to know where the price of silver is headed in 2014. After the huge take-down of the price of gold and silver in 2013, investors want to know if silver has finally put in a bottom and is getting ready for a new move higher this year If investors are banking on much higher silver prices in 2014, then the typical Bank & Brokerage House forecasts are not going to provide any guidance or comfort for that trend. Here are the 2014 silver forecasts from the Top Orthodox Analysts:
As we can see, Barclays comes in at the lowest forecast of $19.50, whereas the majority range from $20-21. Bank of America is the only one in the group providing a more bullish forecast of $26.38 for 2014. I have actually come across these forecasts in some of the precious metal blogs. It seems as if investors are now becoming so frustrated by the low price of silver that they are actually accepting the forecasts put out by the MSM analysts. There’s a very good reason to ignore anything these banks and brokerage analysts have to say. If we take a look a what these analysts forecasted for silver in 2013… you will see what I mean:
The majority of these analysts’ forecasts came in December 2012. At this time, the price of silver was trading in the $32-$33 range. CitiGroup was the only analyst that predicted a lower price for 2013, while Commerzbank & Thomson Reuters GFMS forecasted higher prices in the $40 level. According to Kitco, the average price of silver in 2013 was $23.79. So, all of these Banks missed their forecasts by a wide margin. What is surprising is the forecast made by Thomson Reuters GFMS. This is the same company that produces the World Silver Surveys. The World Silver Surveys provide detailed supply and demand data on the global silver market. If anyone has a good idea of where the price of silver is headed, you would certainly think Thomson Reuters GFMS would be the best qualified. After Thomson Reuters GFMS blew their 2013 silver forecast by a whopping $17+ over the average price of $23.79, they have become a great deal more conservative in 2014 with a forecast of $20.42 for the year. Why Typical Silver Forecasts Should Be Ignored I stopped paying attention to the majority of silver forecasts years ago… especially those from the typical bank and brokerage houses. The reason why I don’t believe in these worthless forecasts or technical analysis is due to the fact that we don’t have free markets. Rob Kirby discussed this issue in an interview, Colossal Fraud: There Are No Free Markets with Greg Hunter at USAWatchdog.com. Kirby explains that the Interest Rate Swap market has dwarfed the entire financial system:
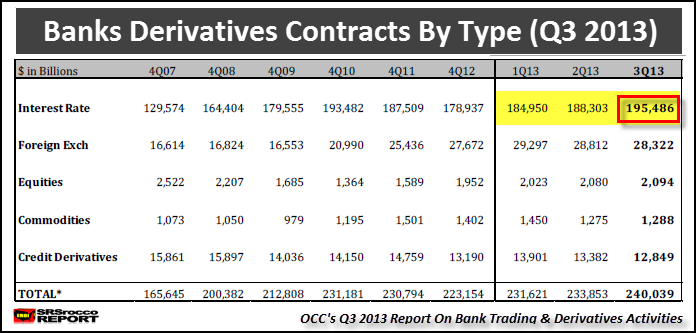
Kirby is quoting figures from the OCC – The Office of Comptroller of the Currency. I went to the site and downloaded the Q3 2013 Derivatives Report. Here is a table showing the banks derivatives contracts by type:
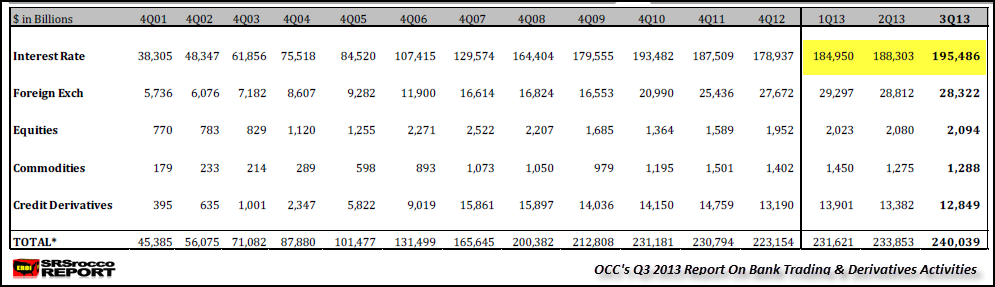
Here we can see that the total amount of Interest Rate Swap contracts have increased in the top U.S. Banks from $184.9 trillion Q1 2013 to $195.4 trillion in Q3. When I do the math, I get an increase of $10.6 trillion. Maybe Kirby is including additional data to get that $12 trillion figure that I am not aware, regardless it is still a large increase in two quarters. Furthermore, you will notice that the total notional value of the Interest Rate Swap market in the U.S. declined significantly from the end of 2010 (Q4 – $193.4 trillion) to Q4 2012 ($178.9 trillion). However, when the Fed increased QE3 to $85 billion monthly at the beginning of 2013, the trend reversed as the total of the Interest Rate Swap market increased $16.5 trillion from $178.9 in Q4 2012 to $195.4 trillion in Q3 2013. Kirby believes that even with the supposed $1 trillion a year of QE 3 in 2013, the banks had to ramp up its Interest Rate Swap program to keep U.S. Treasury rates from rising. Rob Kirby and Jim Willie both believe the huge Interest Rate Swap market is the mechanism that is keeping alive the whole PAPER HOUSE OF CARDS…. I agree. How much has the Interest Rate Swap market grown in the past 12 years? I have provided the entire table of the banks derivatives contacts below:
It may be hard to read, but you can see that the Interest Rate Swap market has ballooned from $38.5 trillion in Q4 2001 to $195.4 trillion Q3 2013. The Interest Rate Swap Market was supposedly designed to protect the borrower against higher costs if rates increased. Unfortunately, the artificially low Fed induced interest rate policy has put severe pressure on those entities who got in bed with the banks with these Interest Rate Swap products. According to the article, How Interest Rate Swaps Are Crushing America’s Cities:
You see, U.S. cities and their agencies have been on the wrong side of bad bets with the Big Banks. Now, these municipal agencies are struggling to cover their losses. So, as interest rates continued to decline, these small towns, cities and municipalities had to pay the Big Banks huge payments. The article explains how the Interest Rate Swap works:
Because interest rates have been kept artificially low by Fed intervention, the majority of these cities and towns are paying the banks dearly. However, the real threat is not from these banks making money on lower interest rates, but the disaster that takes place when rates rise substantially. As rates rise, then the banks will have to start paying the towns and cities instead of the other way around. So, the higher interest rates go, the more losses the Big Banks will suffer. The massive Interest Rate Swap Derivative Market has destroyed the ability for the financial system to function properly. The U.S. Banks now hold the most Interest Rate Swap derivatives ever at $195 trillion. So, What Does This Have To Do With Silver? The Bank with the largest amount of derivatives in the United States is JP Morgan. JP Morgan held $73.2 trillion in total derivatives in Q3 2013, including $83.5 billion in Gold & Precious Metal Derivatives… 81% of the top 4 bank total of $103.4 billion. Silver Analyst, Ted Butler believes JP Morgan has been instrumental in controlling the precious metal market. From his recent article, 2013 – The Year of JP Morgan:
I have to agree with Butler here. Not only is JP Morgan now long gold, they have drastically reduced their net short silver positions. Furthermore, the Fed and its member banks (JP Morgue’n & Goldman Sacked) aren’t that stupid to push the price of gold and silver below its primary cost of production for an extended period. According to my analysis, the top 12 Primary Silver Miners estimated break-even for Q3 2013 was $21.39. I have not done the analysis yet on the top gold miners, but from what I understand their break-even is around the $1,150-$1,200 area. As I have stated several times, I don’t believe in Technical Analysis in a rigged market. I am quite surprised professionals still pay attention to this meaningless metric. Lastly, I am not quite sure of where the price of silver will go in 2014. There are just too damn many variables. We could see an explosion in the price if we do get the “RUMORED” Global currency reset. We could see a sharp move higher in the first quarter with a retrenchment and then a move higher by the end of the year. Whatever the price movement, I doubt we will see much lower prices. That being said, I have not invested in silver for short-term gains. I believe in holding for the longer term. Gold and Silver will be some of the best investments to own in the future… it just takes a great deal of patience to realize the gains. |
|---|
Send this article to a friend:
 |
 |
 |