
January
22
2013
22
2013
|
January 22 2013 |
The One Chart That Explains the Massive Risk of Investing 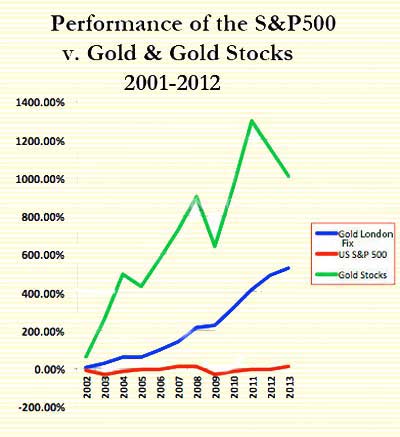
Viewing the chart to the right, a six-year old child could tell you that investing in physical gold and gold mining stocks (as indicated by the AMEX HUI gold bugs index) yielded returns from 2001 to 2012 far superior to the returns of the US S&P 500 Index over the same time period. In fact, the truth of this statement is so self-evident, that if this same child was asked what asset classes he should have been invested in over the past decade by viewing the above chart, the simplicity of that question might lead him to think that one is asking a trick question. So why is it that all the leading Wall Street investment firms stated during the visible onset of the global financial crisis in 2008 (versus the real onset of the global financial crisis quite a few years earlier) that gold was one of the riskiest assets in which one could possible invest? The simple answer, of course, is that if they were the ones involved in the scam to take gold and silver prices down back then, then certainly they would not tell you that the steep, rapid (but short-lived) drop in gold/silver prices was a massive buying opportunity. However, if a six-year old can see what is so obvious, then why should a man of Warren Buffet's prominence continue to slander gold and why does his right-hand man, Charlie Munger, make idiotic statements like "gold is a great thing to sew in your garments if you're a Jewish family in 1939" but not to own, instead of just stating the truth that "physical gold (and physical silver) was one of the best assets to build wealth since 2001"? And if a six-year old can look at the above chart and immediately know that he or she should have beeen invested in gold and gold assets, why, according to the World Gold Council, is still only 1%, or $146 billion of the $146 trillion investable global assets, invested in gold, and 9.1% invested in money markets, 48.7% in fixed income, 37.2% in equities and 4.0% in alternative investments? (though these most recent statistics are from the end of 2010, it is doubtful that these statistics have changed much in the past two years.) One of the main reasons why it is still likely that only 1% of all global invested assets are invested in gold is the psychological hatchet job that Wall Street and the global banking industry has performed on gold and gold stocks. For decades, bankers have repeated their false mantra that "gold and silver are incredibly risky", using the strategy that if you tell a lie often enough, it may just be accepted as truth by the masses. The fact that millions of investors today still won't even consider buying the top performing asset classes for more than the past decade (physical gold and physical silver, NOT the GLD and SLV), serves as testimony to the success of the bankers' anti-gold, anti-silver propaganda campaign. Thus, the reason why just a piddling amount of investors around the world have allocated a substantial amount of their resources to gold, silver and PM stocks as of today is due to, quite simply, investor psychology. The commercial banking industry spends billions of dollars every year in marketing campaigns (exclusive of their investor relations budget), influencing and shaping investors' beliefs into accepting a heaping pile of false beliefs. For example, according to Forbes Magazine, Bank of America spent $2 billion and Citigroup spent $1.6 billion in 2010 marketing expenses, and the biggest banks spent even far more for their annual advertising budget in recent years. As a result, bankers have been able to convince their clients that what is right for them (physical gold, silver and PM stocks) is wrong, and what is wrong for them (investing in global developed stock markets) is right. Why else would anyone stay invested in the US S&P 500, an index, that from 2001 to the start of 2012, was still in the red (not even accounting for the effects of inflation), but for one's blind obedience to one's investment adviser that sells his clients on that moronic 100-year chart of US stock returns that shows an upward progression of US stocks over an entirely irrelevant 100-year period, and keeps telling his clients to be patient, because the "US market, in the long-run, has always returned a phenomenal yield"? So here is how investment advisers, all over the world, convince their clients to ignore a chart, that in plain sight, tells them that being invested in gold & gold stocks (and silver & silver stocks) for the last 12 years over any of the developed broad stock market indexes in the world was clearly the unequivocal correct decision. Below are the four methods global investment bank investment advisers employ to convince their clients to keep doing what is best for himself and his firm (earning the firm management fees) and what is worst for themselves (degrading their investment portfolios and wealth):
For example, when the S&P 500 index crashed, US investment advisers used the bounce from 666.79 in March, 2009 to a high of 1219.80 in April, 2010 to falsely promote the "soundness" of the US stock market like ravenous hyenas that had stumbled upon an abandoned lion kill. In other words, they ignored the "bad" volatility of a 57.69% crash to take the S&P500 down to 666.79 level and repeatedly promoted the fact that the 82.94% increase in the S&P500 was "one of the best in history" over and over and over again on television, radio and newspapers, even though the S&P 500 has still failed to regain its previous high of 1576.09 prior to the crash in October of 2007. Furthermore, though gold stocks had crashed too during this time, all global bank advisers absolutely ignored the much more significant 343% increase of the HUI gold mining index between October 24, 2008 from 150.27 to a high of 516.16 on December 2, 2009. Forget that over this same time period, gold stocks outperformed the US S&P 500 index by 313%. How many people knew that gold stocks rose 343% during this time? Probably less than 1% of all investors. The focus of global investment advisers is to bury statistics like this that compete with their precious legalized casinos called stock markets and to keep their clients invested in their legalized casinos that are stacked against their clients even when far better opportunities exist.
For example, there have been tons of articles written over the last 3-years that have titles like "What's Wrong With Gold and Gold Stocks?" and "Why You Should Not Invest in Gold or Gold Stocks". Commercial investment advisers are amazingly keen to talk about holding on to stocks for a long period of time because they state that one can't judge performance over a 2-3 year period when stocks are not performing. Yet when broad stock markets go through flat periods, as the US stock market has been trapped in a 12-year period now with virtually no gains, you will never ever, not once in a blue moon, not in a million years, see a blizzard of articles shouting, "What's Wrong With the US Stock Market!” Yet, bankers ensure that the mass media is flooded with articles about flat or poor performance of gold and silver stocks during the past three years to keep their clients away from PM stocks and they harp incessantly about this matter while completely ignoring multi-year trends in gold and silver mining stocks and keeping this information buried as well. So let's look at both asset classes and compare performance over a reasonable 12-year investment period, not the ridiculous 100-year chart investment advisers are so keen to use. If one looks at a reasonable 12-year period between 2001 and 2013, the S&P 500 has not even returned a piddling 9% during this period, while gold has returned a whopping +524.77% (silver also returned a phenomenal yield over this same period as well). And what about gold stocks, even when including the very flat last three years of performance? An almost unfathomable +1009.86% return when compared to the US S&P 500's anemic return of 8% and change.
A great many people are afraid to concentrate their assets in gold and silver, among the best performing assets of the last 12 years, because for decades, the commercial investment industry has pounded into their brains that anything but diversification when it comes to investing is unsafe, unsound and risky. Yet diversification is a rubbish strategy used by all commercial investment advisers precisely because they lack the expertise and knowledge to know how to concentrate a portfolio properly without excessive amounts of risk. If you have the expertise, you can utilize concentration without increasing the risk of a portfolio. That's why for years, we've been advocating our clients to invest very substantial amounts of their portfolio into physical gold and physical silver because frankly, despite the notorious volatility of gold and silver, we just didn't consider gold and silver risky when they were respectively $560 a troy ounce and $9 a troy ounce. In fact, every year for the past 12 years, gold and silver has fallen to price ranges that marked solid entry prices that were low-risk, high-reward. The artificial banker-created volatility through manipulation of gold and silver prices ensured this. A recent study by Nobel Laureate Daniel Kahneman tracked a group of 25 wealth advisers/portfolio managers and the variance of their portfolio yields over an 8-year period. At the end of his study, Kahneman stated that he was "shocked" to discover almost no variance in the portfolio performance over the group of managers, simply because he believed that portfolio management was a task that depended upon skill and expertise. Consequently, Kahneman expected wide-variance among the managers as far as performance yields over an 8-year period were concerned. Instead, he discovered that the variances among the performance yields suggested that portfolio management was not a skilled job but one that nearly entirely revolved around blind luck. My first reaction to Kahneman's study was that he should have started his study by sitting in an office of Goldman Sachs or JP Morgan for 3-months and he would have learned within 3-months what it took him 8-years to conclude – that Portfolio Managers have no skill and that they all use the terrible strategy of diversification to cover up their severe skill deficiencies rather than diversification being a strategy that allows them to demonstrate their skill. How many US clients were protected by the strategy of diversification in 2008 when US markets collapsed by 38.50%? By the anecdotal information I gathered, all my contacts at the big US global investment firms told me that nearly all their clients were down the same 35% to 40% that year as the S&P 500 Index. Therefore, diversification did nothing but assure that nearly all clients suffered the same uniform losses as the major global developed indexes that year. In fact, diversification is a protective strategy embraced by the global investment industry as insurance against “client flight”. In other words, if all client portfolios show remarkably similar losses across multiple commerical investment firms during poor years of stock performance, the risk of client flight is small. On the contrary, we at SmartKnowledgeU, have always taken the strategy of concentration over diversification, and in 2008, though it was a nominal gain, we still managed to yield nominal positive returns in our newsletter investment portfolio despite massive losses in all developed global stock markets. Massive outperformance can, and often, will be the result when skill and expertise, instead of luck, is applied to investment strategies. If concentration is so dangerous, and if diversification is a far superior strategy as nearly all investment advisers claim, then it may be possible for one fluke year to occur. But it is near impossible for five fluke years to occur. However, we at SmartKnowledgeU have been concentrating our Crisis Investment Opportunities portfolio since mid-2007 when we first launched, every year now for more than five years. Over that 5-½ year period, we've outperformed the S&P 500 by +161.95% and even outperformed the HUI gold bugs index by +120.80% due to the strategies we use to take advantage of the banker-induced volatilty in gold and silver markets. So much for diversification and buy & hold being wise investment strategies.
The reason some of you may be shocked by the chart I've presented above is not only due to the tactics of #1 to #3 employed by the global investment industry, but also because of one additional key factor. Many of you may think that gold & gold stocks are way more volatile than my chart above shows, and you would be correct. I've only plotted the beginning price level of each asset above at the beginning of each year to smooth out all the interim volatility, so that everyone can clearly see the trends of each asset, even in the notoriously volatile gold (& silver) mining stocks. The reason I've stripped out the volatility in the above chart is because anyone that has studied the price behavior of gold & silver assets knows that Central Banks and bullion banks deliberately introduce volatility into gold & silver assets to intimidate gold & silver newbie investors into terrible decisions of selling all their gold & silver assets, or to scare off potentially new gold & silver buyers from ever buying. Though a commercial investment adviser would never tell you this secret, the evidence of this is overwhelming and since I've blogged many times about this very topic over the past 7 years, I'm not going to go into detail about the mechanisms by which the banking industry deliberately creates volatile prices in gold and silver assets in this article. However, since the banking industry has already sold the masses hook, line and sinker, on the very false mantra that "volatility = risk", by artificially and deliberately causing short-term volatility every year in gold and silver assets, commercial investment advisers can show their clients charts of gold, silver and mining stocks with all intra-day, intra-month or intra-year volatility, and keep convincing their clients that gold and silver are the riskiest assets in the entire investment universe while convincing them that broad stock market indexes are the safest arenas in which to invest, when indeed, the exact opposite has been true for 12 years, and will likely be true for the next decade as well. Sure, one has to understand how and why the bankers create volatility in gold and silver assets to ensure that one enters these assets at low-risk, high-reward price points instead of high-risk, low-reward price points in order to be successful, but anyone that has studied gold and silver price behavior and understands how bankers manipulate gold and silver prices should now have the expertise to provide this guidance and help novice gold/silver investors navigate through all the rubbish manipulative schemes of bankers. If one doesn’t understand what drives gold and silver prices and one enters at a high-risk, low-reward entry price, then certainly, one could have been taken to the cleaners after banker conducted raids against gold and silver executed in the paper markets, despite what the above chart illustrates. In addition, bankers also attempt to keep people out of buying physical gold and silver and PM mining stocks by painting charts to drive and intensify fear of gold and silver collapses during their multiple, annual banker raids on gold and silver prices. Every year, after there is intense short-term volatility in gold & silver in the form of a 3-5% drop in gold and/or silver in just a couple days, more than a handful of pure technical chartists will come out of the woodwork to predict massive collapses of silver and gold. Last year, when these situations occurred, more than a few chartists unnecessarily stoked fires of panic by predicting imminent collapses of silver to $20 an ounce and gold back to $1200 an ounce (or even lower). And every year, these predicted collapses of a gold "bubble" and silver "bubble" never materialize. But these false predictions gain enough publicity to keep many too scared from buying their first ounce of physical gold, physical silver or their first PM mining stock. Again, remember that bankers deliberately paint these gold and silver charts to give the appearance of an imminent collapse in prices even though the underlying, undiscussed fundamentals of the physical bullion world often directly contradict the price action of gold and silver during banker-executed raids on the PMs. This is why I have maintained for many years that technical analysis in gold and silver (and even in the highly rigged stock markets) is quite useless if conducted in a vacuum. However, if one uses technical analysis in conjunction with analyzing the underlying fraudulent mechanisms of what is causing great volatility in gold & silver markets, then one is much more likely to accurately assess these rapid declines in gold and silver price as buying opportunities as opposed to fostering clients to panic sell their PMs like fleeing lemmings off a cliff’s edge. As Nobel Laureate Daniel Kahneman recently discovered, and as we've been stating at SmartKnowledgeU for nearly a decade now, the entire financial industry is built upon deception and rigging of markets. Their entire existence as ongoing, viable entities is based upon the creation and maintenance of an illusion among all their clients that they know what they are doing even though they do not, and even though they have recommended the same course of action for the past 12-years that has greatly failed. As long as the commercial investment industry can keep this illusion going, they can keep convincing their clients that gold and gold stocks (as well as silver) are the riskiest investments ever and simultaneously prevent their clients from realizing the simple truth self-evident in my one chart above and from escaping the inertia of their poor advice. Furthermore, since the conditions that launched this present gold & silver bull are even stronger and more favorable today than at the start of this PM bull, the reasons to be invested in gold (silver) and gold stocks (& silver stocks) are even stronger today than they were 12 years ago. In conclusion, ignore the simplicity of the above chart at grave risk to your own future financial health and security. About the author: JS Kim is the Founder & Managing Director of SmartKnowledgeU, a fiercely independent investment research & consulting firm with a mission of education and helping Main Street beat the corruption of Wall Street. SmartKnowledgeU was the first company in the west to move to a gold standard of pricing, a pricing mechanism to which the firm has remained firmly committed, even when gold prices have been moved lower by bankers as in recent times. Currently, we are offering a 5% to 10% discount on all SmartKnowledgeU services until the end of January only, a discount that when combined with our significant discount in prices due to current lower gold prices, will almost assuredly mark our lowest prices of the year for 2013. Follow us on twitter @smartknowledgeu. |
 |
 |
 |