
Send this article to a friend:
November
07
2023

|
Send this article to a friend: November |
|
A "Sucker Breakdown" Fools Investors… Again!
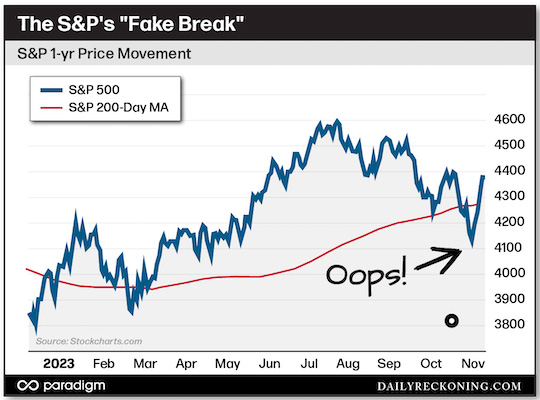
You’ve heard of a sucker rally… But what about a sucker breakdown? We might have just witnessed one asinvestors jettisoned their stocks last week just before a huge snapback move that began with frantic short-covering rallies — and could end with an epic melt-up into the holidays. Here’s how it all started… It was looking bleak for the bulls heading into November. The major averages had just logged their third straight monthly decline, with the S&P giving back every cent of its summer gains. A messy geopolitical landscape continued to dominate the headlines as war intensified in the Middle East, fueling fresh protests throughout Europe and the US. A Fed meeting was also looming large over the markets. Any new hawkish comments threatened to trigger a fresh wave of selling, potentially shoving key stocks and sectors below support. Sentiment was in the gutter and the bulls were nowhere to be found. I’m sure there were more than a few investors yanking their money out of stocks, loading up on puts, and doing their best to resist smashing the panic button and retreating to the bomb shelter to wait out the crash. But as we discussed last week, these are the exact market conditions that should prompt you to watch for a bounce. Panicking while everyone else is panicking rarely pays. In fact, this type of herd behavior consistently punishes emotional investors – the folks who blindly buy stocks without any clue as to what to do next. Today, I’m going to show you why I’ve been on the lookout for a sharp rally, why the market bounced where it did, and how you can regroup if you missed last week’s big move off the lows. A Technical Tourist Trap On Oct. 20, the S&P 500 closed below its 200-day moving average for the first time in seven months. Moves like this always seem to attract the technical tourists. These folks love to draw their little lines on charts and swear that stocks have to obey their every command. Of course, any break of one of their magical long-term moving averages spawns more than a handful of breathless reports proclaiming that the market is looking wobbly and cratering below an important support level. But as any seasoned trader will tell you, a moving average isn’t a mystical line that releases some sort of stock-killing poison when price breaks beneath it. In reality, it’s simply a smoothing device that helps us identify the primary trend. More importantly, you tend to see longer-term buyers stepping in to buy when price moves below a rising 200-day moving average. And in case you’ve been stuck under a rock (or inside a bear cave) this year, the 200-day bottomed out during the second quarter and has been pointed higher ever since.
Again, there are no guarantees in the market — and a breakdown from these levels was (and still is!) a possibility. But rushing to sell everything or short the market on this so-called breakdown would be a fool’s errand. It’s also worth noting that this break below the 200-day took the S&P right back to a confluence of support levels marked by the February and April highs. This was a key area the S&P needed to top to ignite the summer rally, so it should be viewed as strong support for the index, regardless of the relationship to the 200-day moving average. It’s Rally SeasonDespite the three months of choppy descent we experienced after the averages topped out in late July, last month’s drop shouldn’t have set off any alarm bells. Not only are pullbacks and downside moves perfectly normal events, there are also seasonal trends the market has closely followed this year — specifically how the S&P performs during a pre-election year. Earlier this year, I showed you the pre-election year cycle roadmap, specifically how the S&P tends to top out during the summer months in the pre-election cycle and remain in a range until a year-end push. One important caveat when dealing with seasonality data is it’s the trend that counts. And for the entire year, the S&P is more or less following these seasonal trends. Is it a perfect match? Absolutely not. But our composite continues to offer a general idea of what we should expect heading into 2024. While the large-cap index did rally more than I expected into the end of July, it remained well within a normal pre-election year cycle. August is generally a weaker performing month, giving way to a choppy, corrective fall. The market then typically finds a bottom in late October, and investors enjoy a final push higher into December. Sound familiar? This is exactly what we’re seeing play out in the markets right now. To recap: We’ve seen the S&P undercut a longer-term moving average and retest an important support area — all while investors loaded up on downside bets as sentiment sank to extreme bearish levels. The sucker breakdown is in full effect. There are plenty of reasons to feel bearish about the market. But right now, price is telling you to hold your nose and buy into a potential year-end melt-up move. What do you think? Will the rally stick? Or are the bulls still flirting with disaster? Let me know by emailing here.
|
Send this article to a friend:
 |
 |
 |


![[Most Recent Quotes from www.kitco.com]](http://www.kitconet.com/images/live/s_gold.gif)
![[Most Recent USD from www.kitco.com]](http://www.weblinks247.com/indexes/idx24_usd_en_2.gif)
![[Most Recent Quotes from www.kitco.com]](http://www.kitconet.com/images/live/s_silv.gif)