
Send this article to a friend:
November
30
2023

|
Send this article to a friend: November |
|
Gold Price Forecast: Breakout Alert
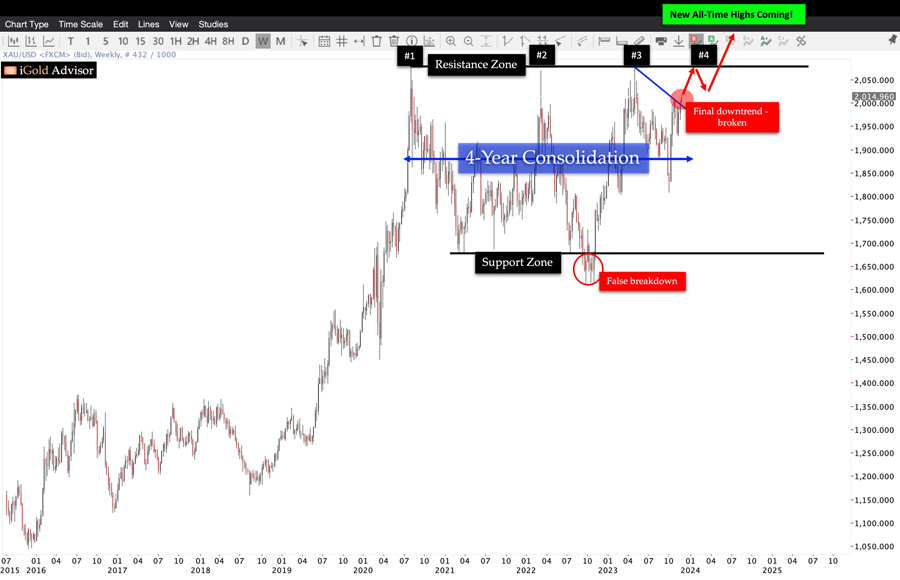
New all-time highs appear to be on the precipice for the precious metal. In this article, we will detail the trigger points for gold’s breakout, the pathway forward for the precious metal, and how investors should prepare. Gold’s 4-Year ConsolidationBelow we show gold’s ongoing 4-year consolidation between $1,615 and $2,075:
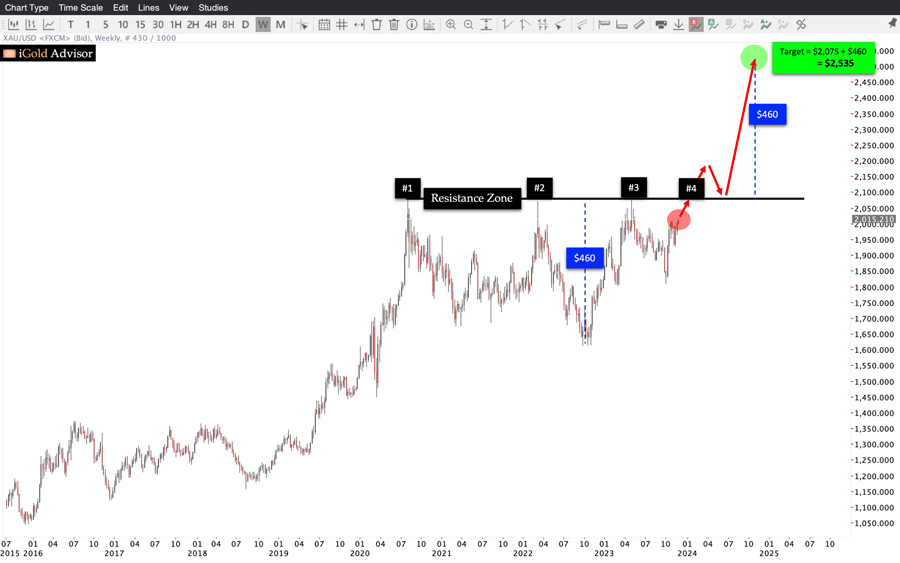
Note that gold has attempted to overcome the key $2,075 resistance zone three times within the last four years. Also note that the final downtrend which starts from gold’s attempt #3 has already been broken. In other words: there is no further resistance visible on the chart until gold approaches the resistance again, which will represent attempt #4. While we should not use the word “never” in the investment world with respect to probabilities, based on my 20 years of studying technical analysis I would say with confidence that quadruple-tops are extremely rare in the financial world. Markets that bump up against a specific resistance level four separate times throughout the course of four years are generally not topping – instead, they are biding their time in a protracted consolidation before a break out. A Consolidation Before What? If not a top – then the only remaining option for gold is a break out to new all-time highs. Yes, in fact, such is what we expect from the gold market, concurrent or possibly following a slight retracement from attempt #4 on the chart. Gold should be exceeding its resistance level during the first half of 2024 and proceeding to new all-time highs, levels never before witnessed in the history of humankind. How High Will Gold Go? Fortunately for those of us who use technical analysis, we have a reliable way to estimate an eventual price target for gold once it breaks out to new all-time highs. Below we show the exact same gold chart, with additional annotations measuring the projection:
Note that after gold breaks out by registering dual-weekly closes above the resistance zone, we will calculate an official target of $2,535 per ounce for the metal. How do we calculate at this target? The amplitude of the 4-year consolidation is $460 as shown in blue. This is the amplitude representing the number of short-sellers who have entered the market in the preceding consolidation, sellers who attempted to profit as gold declined in price. Whether legitimate hedgers, manipulators, central banks, or individual traders, there is $460 worth of selling pressure that has built-up in the gold market since 2020. Once gold breaks out to new all-time highs, and all of those short-sellers are by definition showing a loss on their balance sheets, we would expect an equal number of those entities to cover their short positions. In other words, $460 worth of short-covering should enter the gold market at sequential price intervals, following gold’s break of $2075. Note that amplitude measurements cannot be used for all price patterns in technical analysis to project targets. Only certain patterns provide reliable amplitude targets. Luckily for us, a sideways consolidation is one such pattern. Some Considerations A price target provides an initial projection only following a breakout. All things considered, this is our highest probability projection for gold. However, markets are always in a state of flux. It is always possible for a new dynamic to enter the market – a black swan event – to cause a target to be negated or even exceeded. This is why we must continue to monitor a market after it breaks out. Furthermore, markets can undershoot or overshoot their projected targets. We might place a high probability $50 band around the precise target as a more liberal target zone; in other words, a $2,485 - $2,585 price zone is probable following the breakout. Even more dramatic undershoot and overshoot scenarios are also possible. However, they are not our base case and would represent outlying scenarios. We always side with the visible chart-based evidence as our base case; if an outlying event were to manifest at some point in the future, we would only then adjust our target expectations. Takeaway on Gold Most mainstream investors are not paying attention to gold presently. Those who casually follow the gold price have witnessed only sideways-type price action over the preceding four years. However, beneath the surface, gold is showing hints of wanting to break out. Markets rarely top in a quadruple formations. This leaves a breakout higher as the only remaining option. Gold has already broken its last downward trend following attempt #3 in May. There is no further resistance until attempt #4 occurs; this could happen at any moment. Once gold breaks out to new all-time highs, we expect the mainstream media to start paying attention to the precious metal. At that point, a large influx of new buyers should emerge leading to a rapid price acceleration. As precious metals investors, we want to position before the masses arrive. Waiting until after the breakout will be too late, as the price could move rapidly following that point. At www.iGoldAdvisor.com, we are preparing to purchase several precious metals-related investments. In addition to bullion, we also invest in gold and silver mining companies, which offer leverage above and beyond the price gains of the metals themselves. We also invest in private placements, which offer higher net-worth investors free warrants in addition to their shares for the highest upside possible. We conduct individual consultations with new and experiences investors alike. iGold Advisor is 100% independent and takes no fees nor kickbacks from any company referenced herein.
|
Send this article to a friend:
 |
 |
 |


![[Most Recent Quotes from www.kitco.com]](http://www.kitconet.com/images/live/s_gold.gif)
![[Most Recent USD from www.kitco.com]](http://www.weblinks247.com/indexes/idx24_usd_en_2.gif)
![[Most Recent Quotes from www.kitco.com]](http://www.kitconet.com/images/live/s_silv.gif)