
Send this article to a friend:
October
05
2023

|
Send this article to a friend: October |
|
Back On Crash Watch
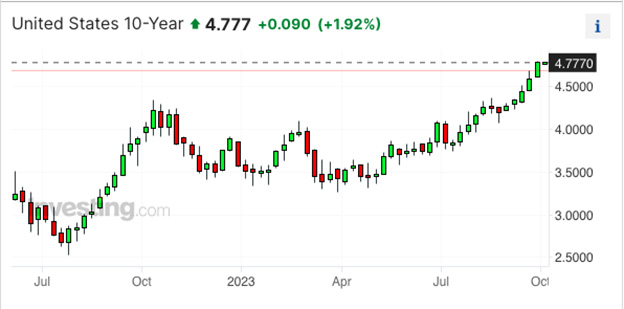
Let's think of this in meteorological terms. For example, a Tornado Watch is issued when the conditions are present for severe thunderstorms and tornadoes. A Tornado Warning is only issued once a tornado is sighted or suspected to be forming. Maybe think of it this way: As such, for now we are on Crash Watch. The conditions for a liquidity-driven market crash are present...and it is October, after all. However, those conditions have not yet combined to create an actual crash. Not yet anyway. Analyzing Precious Metals: Crash Watch in October 2022 as Bond Yields SurgeAnd what are those conditions? Let's start with the bond market. Last autumn, the yield on the U.S. 10-year note began to exceed 4.0% and the stock market began to wobble. Why? Because when the 10-year made it to 3.5% in late 2018, the resulting liquidity event led to an almost immediate Fed pivot on tightening and, eventually, rate cuts by June of 2019. Would that happen again in 2022? By mid-October it sure looked like it, with an intraday low in the S&P of 3492.
But then, as you can see above, the selling stopped and the market magically reversed. Crisis averted. However, here we are one year later and the yield on that same U.S. 10-year note is at 4.75%. Therefore, it's time to issue a Crash Watch again.
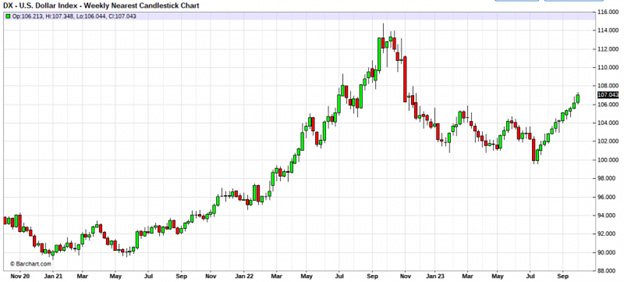
But it's not just the U.S. treasury market. Liquidity appears to be draining from the financial system at a rapid pace. You know about the recent plunge in gold prices, and you've likely heard that the U.S. dollar index is on its way to a record-setting, 12th-consecutive up week, continuing its relentless rally that began back on July 18.
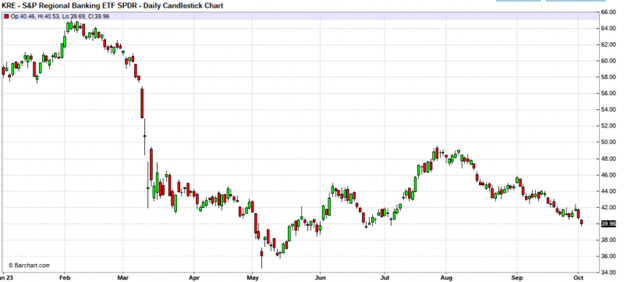
Assessing Financial Stress: Warning Signs in Regional Banks and High-Yield Bonds If you dig deeper, you'll find even more sources of stress. Two weeks ago, we asked you to keep an eye on the regional banks. Six months ago, the Fed created a new facility to house the losses these banks are incurring in the fixed income portfolios. But those losses continue to grow as interest rates rise, and these banks have yet to feel the extreme pain that is coming from their exposure to commercial real estate. In the two weeks since that most recent post, shares in the big regional bank ETF—the KRE—have fallen by over 7%. Seeing this drop below $40 is another Crash Watch ingredient.
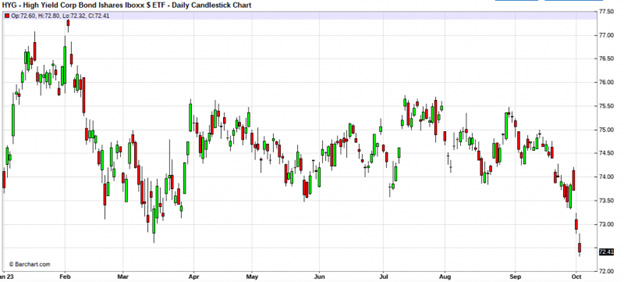
And what about the high yield bond market? This sector is particularly vulnerable to liquidity issues, and it is currently dealing with the double whammy of higher interest rates and a slowing economy. In the latest Sprott Money Monthly Wrap-Up, Rick Rule stated that worries over this sector is what "keeps him up at night". If that's the case, you'd better keep an eye on it too. The best way to track the high yield sector is through any of the big ETFs that trade in the United States. These funds brought in billions of investment dollars over the past few years as yield-starved investors desperately searched for investment income. What happens now that bond prices are falling? Will the gradual exit from these funds turn into a stampede? There's another Crash Watch ingredient for you.
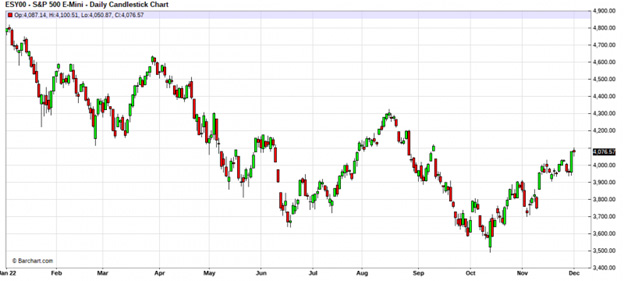
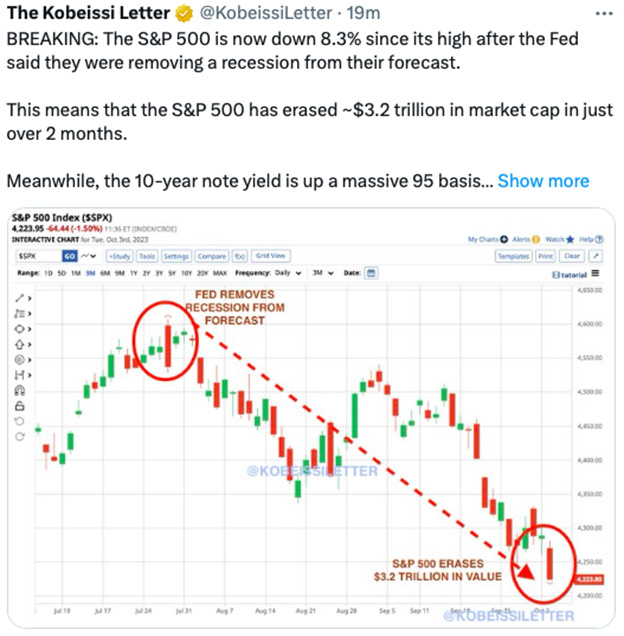
So, what levels do we need to watch and when might the Crash Watch be upgraded to a Crash Warning? Well, the S&P is already down over 8% from its highs of late July. Technically, that's not a crash. That's just a correction. But is it a harbinger of what's to come?
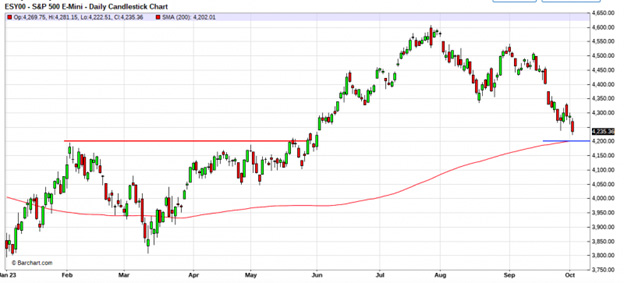
There appears to be very important technical support near the 4200 level on the S&P 500. With the conditions now in place, a substantial drop below that level could necessitate that Crash Warning.
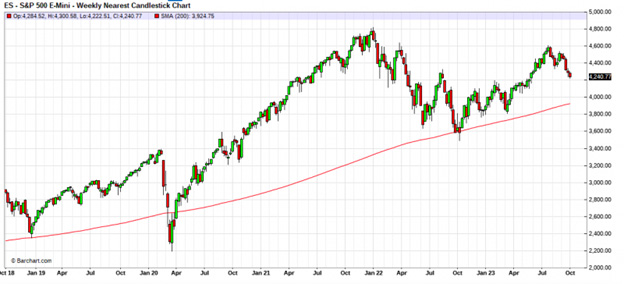
Price Projections for S&P 500: Analyzing Potential Targets Amid Market Uncertainty If the S&P does begin to crash through 4200, how low might it go? This first weekly chart suggests 4000 as a possible target.
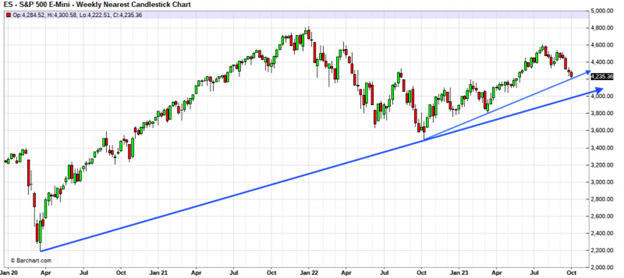
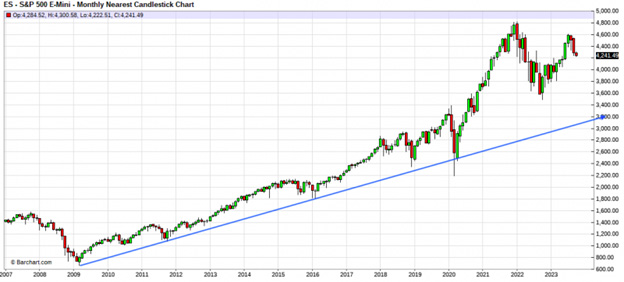
However, recent pullback and corrections have found support at the 200-weekmoving average. As you can see below, that level is currently near 3925, so that seems a logical target too. That's where the selling ended last year, and maybe it will end there this year also? That's only 300 points down from here or about another 7%. No big deal, right? But what if the S&P doesn't stop at 3900? What if we go onto full Crash Warning as the Fed loses control, commercial real estate collapses, high yield bonds crash, and the banks take a nosedive? How far might the S&P fall then? Well, if we take it all the way back to the beginning—March 2009—when the Fed changed the paradigm with quantitative easing and Too Big To Fail bailouts, the target moves to somewhere in the 3000-3200 range. That's almost 30% down from here, and that would definitely be a big deal.
In conclusion, we're now into October and this is seasonally a very weak month for equities. Investors are easily spooked by memories of 1929, 1987, and 2008. They might soon be spooked again. For now, though, we remain on Crash Watch, but keep an eye on this space. If conditions merit a change to Crash Warning in the weeks ahead, we'll be sure to let you know.
Did you know you can get the Sprott Money Monthly Wrap Ups, Ask The Expert, special promotions and insightful blog posts sent right to your inbox? Sign up to the Sprott Money Newsletter here.
|
Send this article to a friend:
 |
 |
 |


![[Most Recent Quotes from www.kitco.com]](http://www.kitconet.com/images/live/s_gold.gif)
![[Most Recent USD from www.kitco.com]](http://www.weblinks247.com/indexes/idx24_usd_en_2.gif)
![[Most Recent Quotes from www.kitco.com]](http://www.kitconet.com/images/live/s_silv.gif)