
Send this article to a friend:
August
18
2023

|
Send this article to a friend: August |
|
A Contrarian’s Take on Gold and Silver
Fundamentals: The Factors Influencing Gold Price It looks like the Fed is done hiking rates, at least for the time being. The probability of another rate hike in September languishes at 11.5%.
While that may change in the next month, as it stands, a pause is bullish for both metals and miners. Inter-Market Analysis Gold and silver are typically inversely correlated to nominal bond yields, real yields, and the dollar index (DXY). This means that when these go up, gold prices and silver prices fall, and vice versa. Gold has a near-perfect correlation coefficient (CC) of 0.90 to TLT, i.e., bond prices. It also has a near-perfect negative CC of 0.88 to the 10-Year Bond Yield and a negative 0.89 CC to real yields. Saving the best for last, gold price has a negative 0.94 CC to the DXY. Bond Yields and Precious Metals
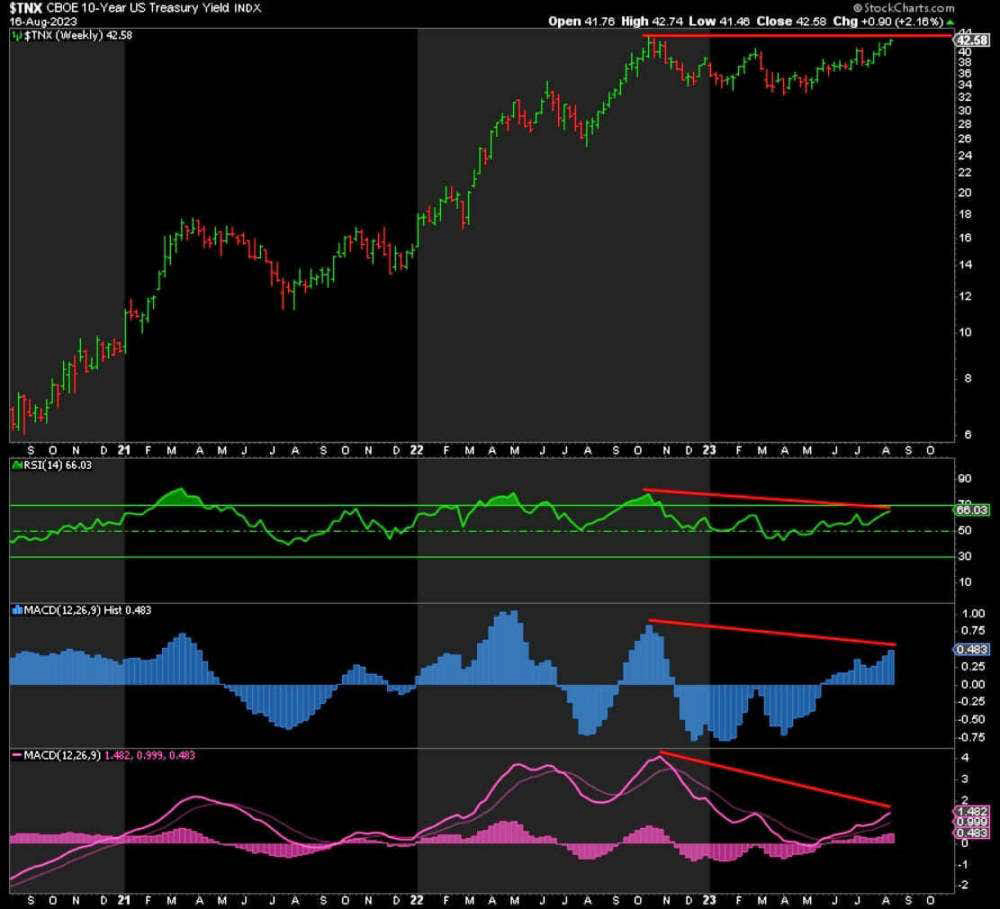
The weekly chart for the 10-Year Bond Yield is close to extreme overbought, just as it approaches the peak of 4.33% from October 2022. This is now resistance. The RSI and both MACDs signal that the bigger risk is that the yield hits a negatively divergent higher high. A fake breakout to the upside would be extremely bearish for yields and bullish for metals and miners. From a contrarian perspective, following the massive rally since the bottom in March 2020, the risk-reward favors the downside from here.
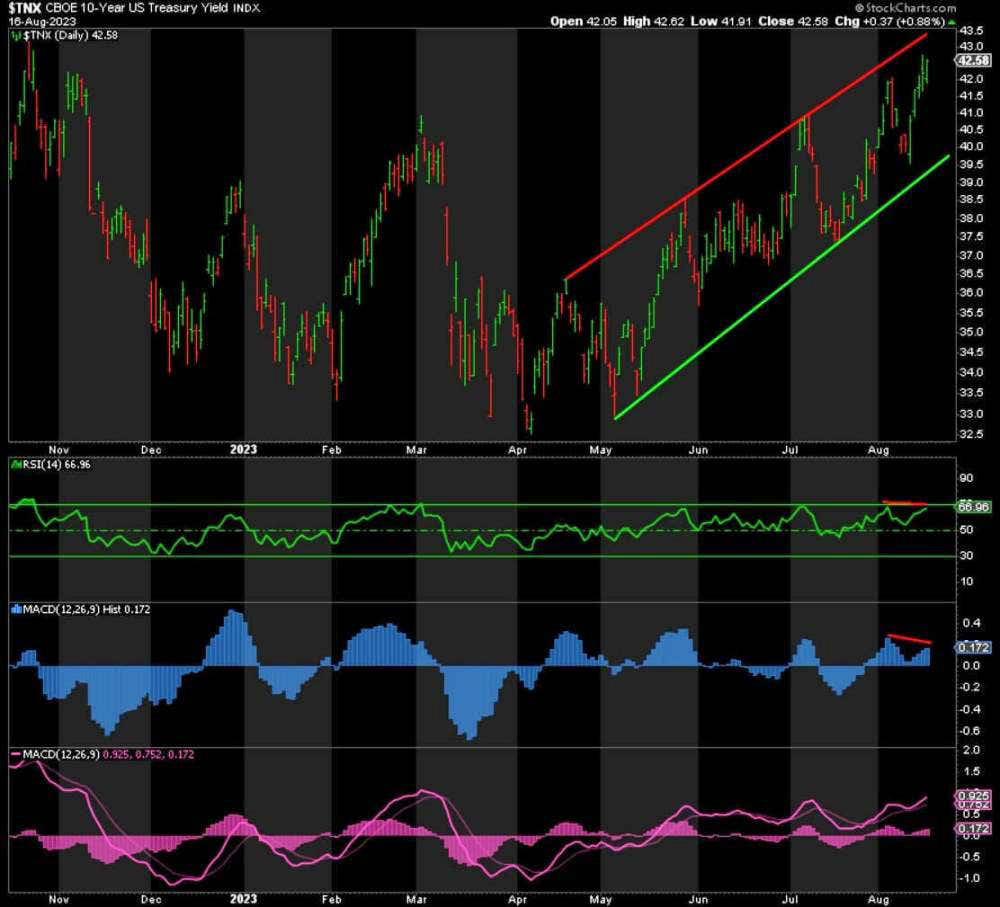
The daily chart confirms what the weekly chart is warning. The RSI is close to extreme overbought and is negatively divergent at higher highs in yields. The MACD Histogram is also negatively divergent. The banks are massively long bonds, expecting lower yields ahead, while the speculators are extremely short. The banks, far more often than not, get it right at extremes. As for the 10-year “real” yield, it closed at 1.96% today. You have to go back to March 9, 2009, when QE1 began, for a higher real yield. That was over 14 years ago! How much longer can the Treasury afford paying the interest on the massive debt at these yields? Again, the contrarian view is that nominal and real yields cannot go much higher from here, but they can go a lot lower, especially if the Fed resorts to Yield Curve Control. This would definitely support higher gold and silver prices. DXY's Influence on Gold and Silver
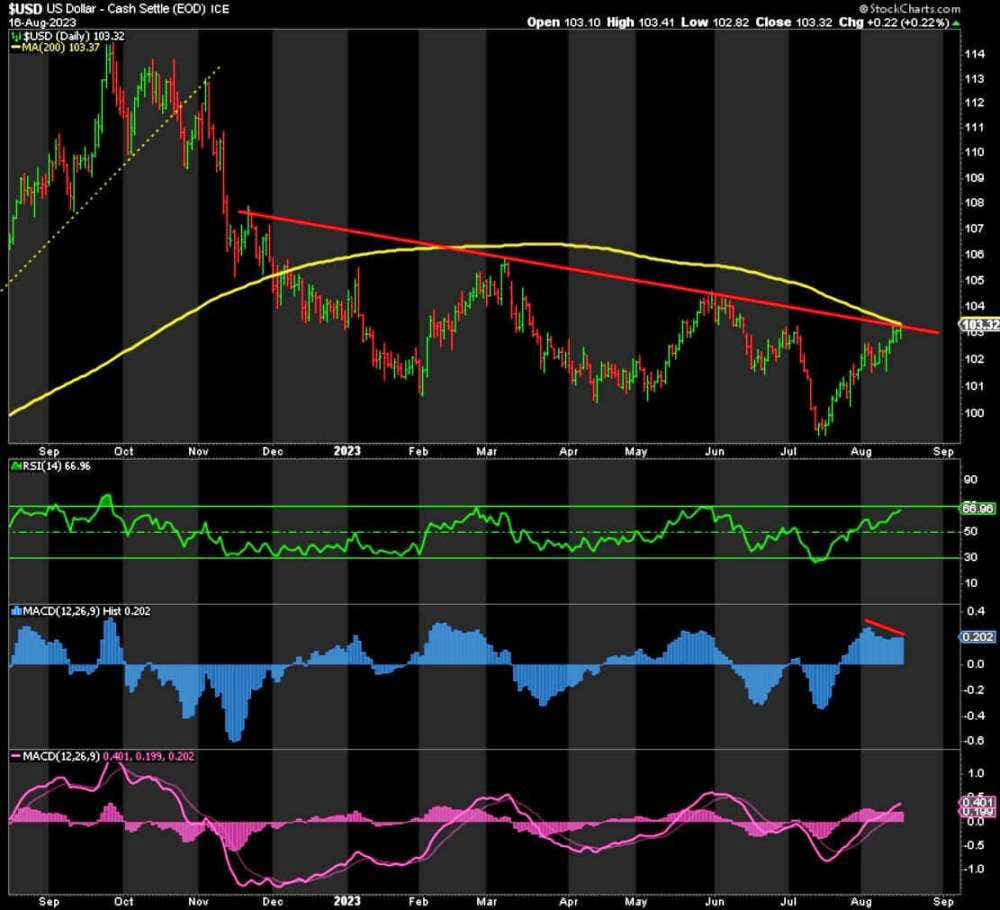
Meanwhile, the DXY is benefitting from these higher yields, but for how much longer? It has run into resistance at 103.40 and the 200-day moving average. Like yields, the DXY is becoming extreme overbought and bullish, and the MACD Histogram is negatively divergent. That said, it could break through and head up to 106 before turning down again, or we could get a fake breakout and head straight down. This contrarian’s targets on the downside remain 96-92. When the DXY turns down again, watch gold and silver prices soar, IMHO. The only caveat from an inter-market perspective is stocks. If we get a mini-crash in the short-term, that could pull both the metals and miners lower again, temporarily. From a contrarian perspective, this just provides another great buying opportunity, like that in October 2008. While I believe the main event in stocks, a massive crash, is still a few months away, even if I’m wrong and it happens sooner rather than later, once the Fed responds with rate cuts and enormous injections of liquidity via QE again, the crash will only delay the rally to new record highs a little longer. If such a crash is triggered by another banking crisis, a far bigger one, the rally will likely be sooner and more explosive, if the rally in March is anything to go by. The rollout of a central bank digital currency (CBDC), accompanied by universal basic income (UBI), would just be the icing on the cake. Gold Poised for a Resurgence
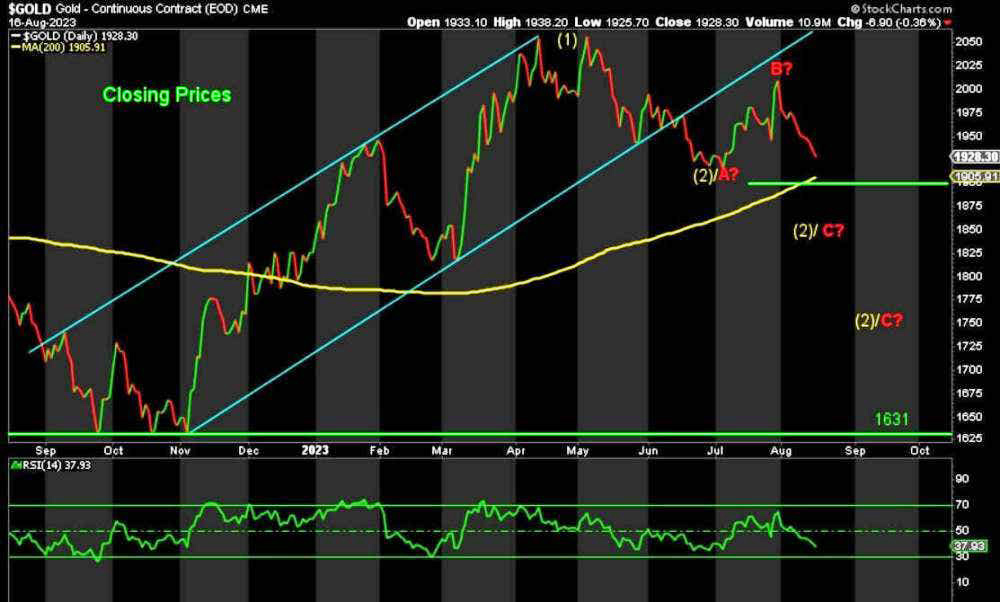
As for gold itself, the situation remains the same. As long as 1900 support remains intact, gold price could turn up very soon and test the record high of 2089. However, a 9% drop to 1900 following a near 30% gain does not seem sufficient to me. If we do break 1900, then a bigger ABC correction is likely underway to 1850 or, worst case, 1750. Although gold is already bearish and is becoming extreme oversold, my preference is for a breakdown. Almost everyone would become extreme bearish, which would trigger the final flush in gold and provide the fuel to take out any and all resistance on the upside to a far higher record level. Anything below 1900 would be sufficient. 1850 would be ideal. On a positive note, the Funds are slashing their long positions as fast as possible, and the Commercials are doing the same on the short side. This is setting up for the rally we’ve all been waiting for. Silver's Trajectory: Testing Support and Rally Potential
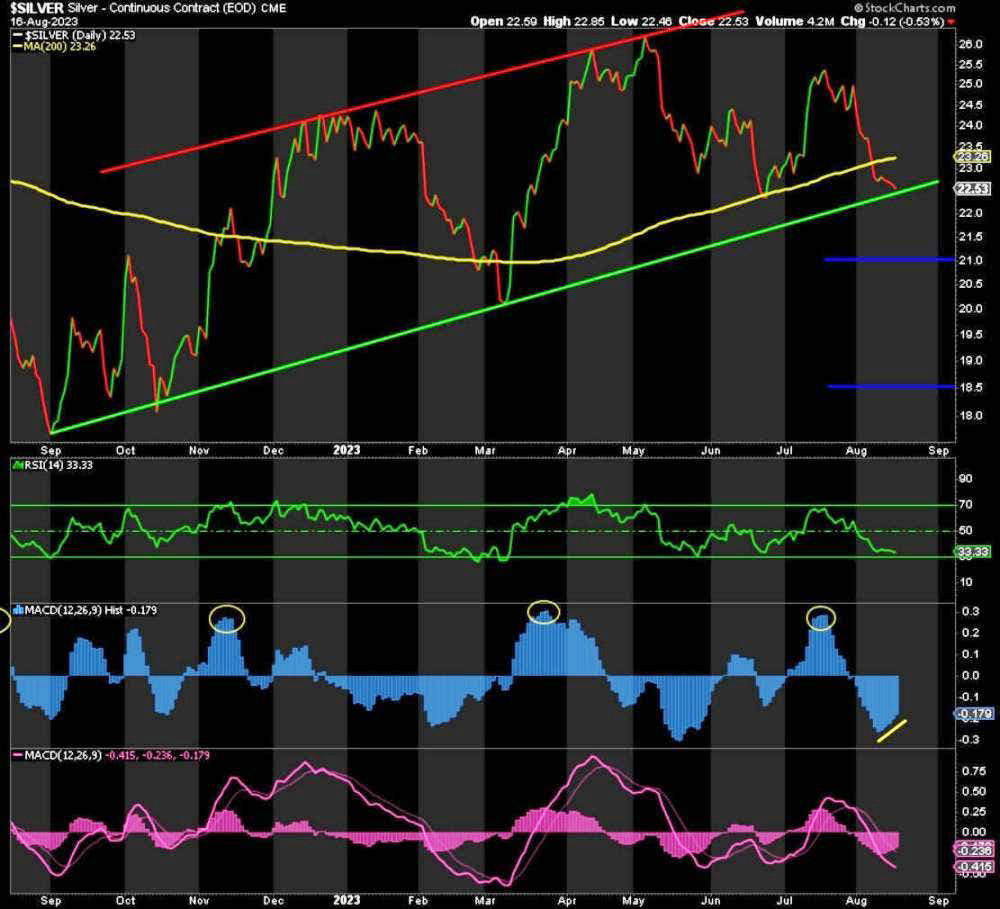
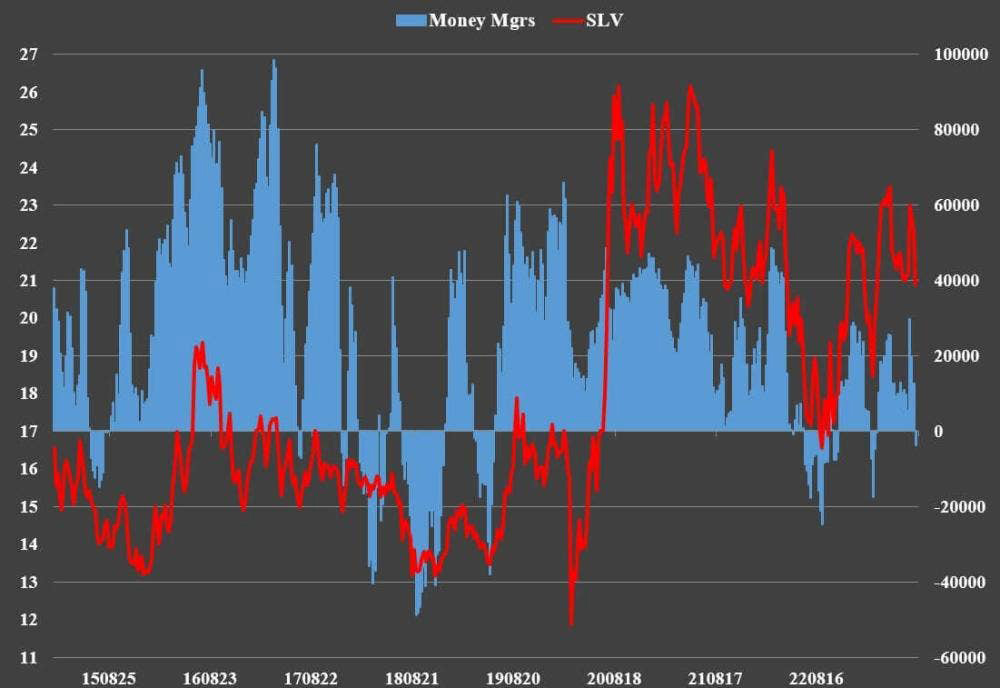
Silver has broken its 200-day moving average. It is now testing trendline support. My targets remain the same on the downside at ~21 and, worst case, 18.50. Silver is close to extreme oversold. Like gold, it is bearish but could be more so. But it is the positioning that is the most telling. As of August 8th, the banks were net LONG and the money funds were net SHORT.
Since then, the price has continued to fall. This means that the funds are likely even shorter and the banks have increased their long position. So while silver continues south, this contrarian focuses on the fact that the ideal conditions are falling into place for a truly spectacular rally to the upside. Conclusion: Gold and Silver Market Prepares for New Record Highs While we will have to endure a little more pain on the downside, the data says everything is setting up for new record highs and then some in the coming months.
|
Send this article to a friend:
 |
 |
 |
 Even though all major lows in the metals and miners are by definition extreme oversold and universally bearish, the majority of retail traders, and many professionals too, throw in the towel at such troughs when they should be buying. Today, I want to provide a contrarian’s perspective on
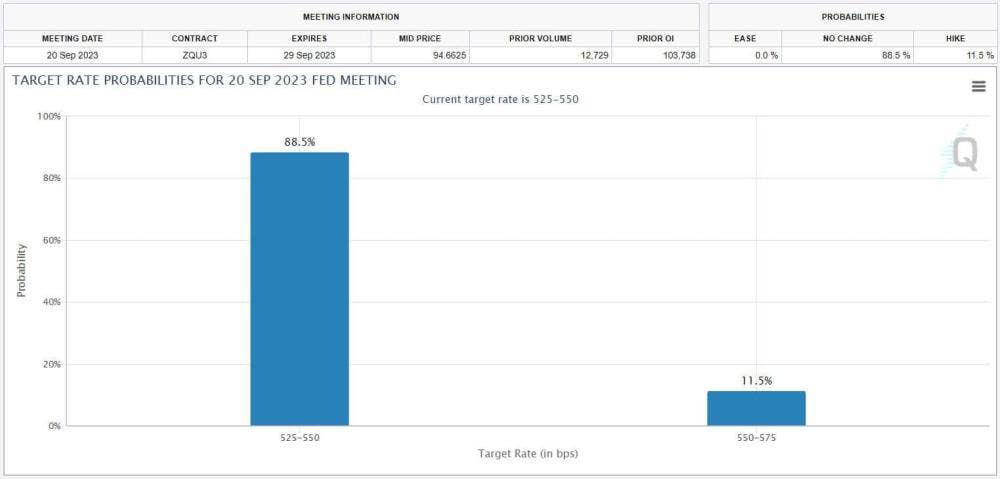

![[Most Recent Quotes from www.kitco.com]](http://www.kitconet.com/images/live/s_gold.gif)
![[Most Recent USD from www.kitco.com]](http://www.weblinks247.com/indexes/idx24_usd_en_2.gif)
![[Most Recent Quotes from www.kitco.com]](http://www.kitconet.com/images/live/s_silv.gif)