
Send this article to a friend:
June
14
2021

|
Send this article to a friend: June |
|
Answering The "$64 Trillion Question": A New Theory Of Inflation
Summary
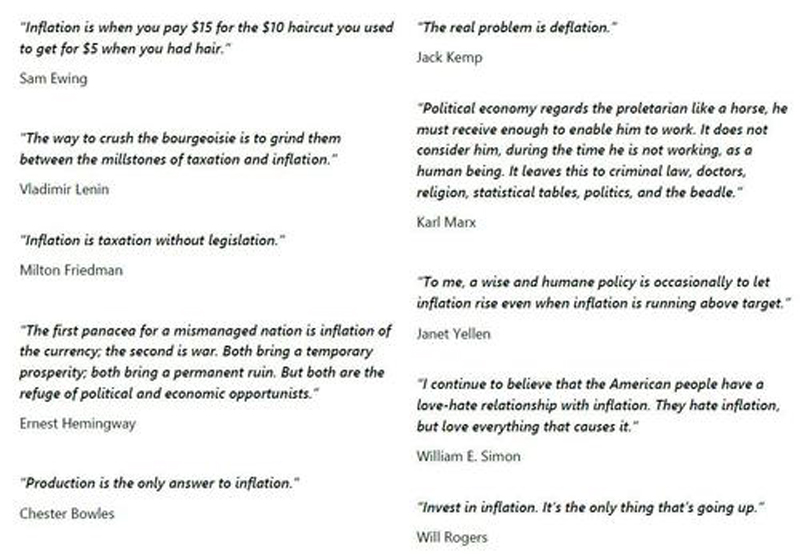
Inflation in inflationsThe topic of inflation is very much on the mind of markets and businesses. Despite a dip in recent weeks, Google Trends shows the highest global interest in the topic since the Global Financial Crisis of 2008 (Figure 1).
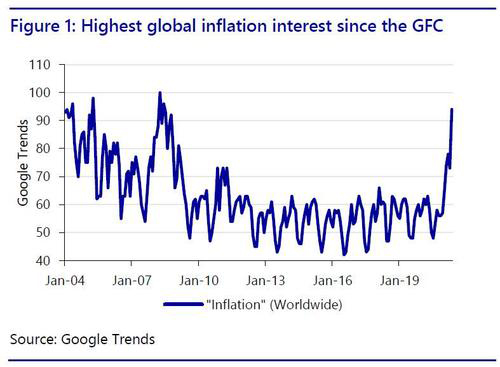
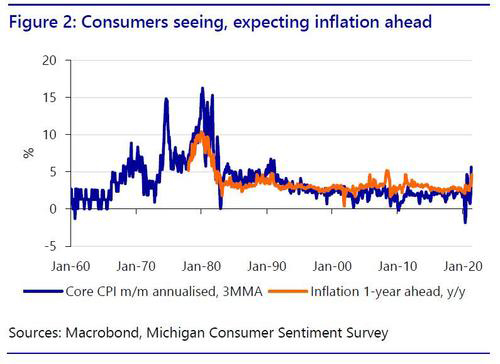
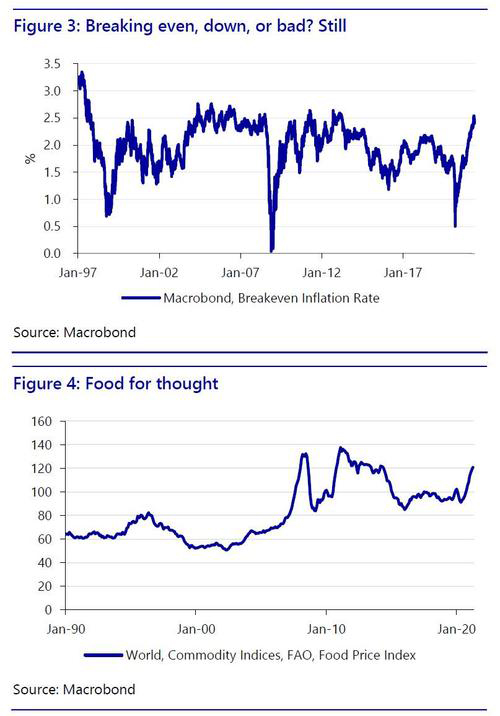
One can see why inflation is a topic of discussion: it is supremely important in determining the valuation of tens of trillions of USD in global financial assets, from stocks to bonds to property to currencies. Moreover, after decades of slumber, its future direction is unclear. Some key measures of inflation are at multi-year or multi-decade highs: US CPI, ex- food and energy, on a rolling 3-month annuali\ed basis hit 5.6% in April, the highest since 1991; the US Michigan consumer sentiment survey year-ahead inflation expectations index rose to 4.6% in May, the highest level since August 2008 (Figure 2); the 10-year US breakeven inflation rate (a proxy for investor expectations) has also moved to 2013 levels (Figure 3); gold has started to climb since May; and despite recent dips in some commodities, the FAO’s global price index was the highest since 2014 in April (Figure 4).
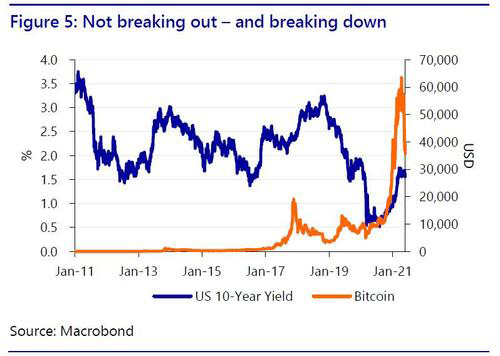
However, not all inflation indicators are moving in the same direction. Benchmark US 10-year Treasury yields are still around 1.55% rather than pushing to 2.00%; and Bitcoin, taken as a proxy inflation hedge, has also seen its price tumble (Figure 5).
In short, will current high inflation prove “transitory”, as central banks tell us, or “sticky”, as consumer surveys suggest, or could it even break higher – or much lower? This is the proverbial ‘$64 trillion question’ given the scale of assets involved. If we could, we would The problem is, we seem universally incapable of answering it by forecasting inflation correctly!
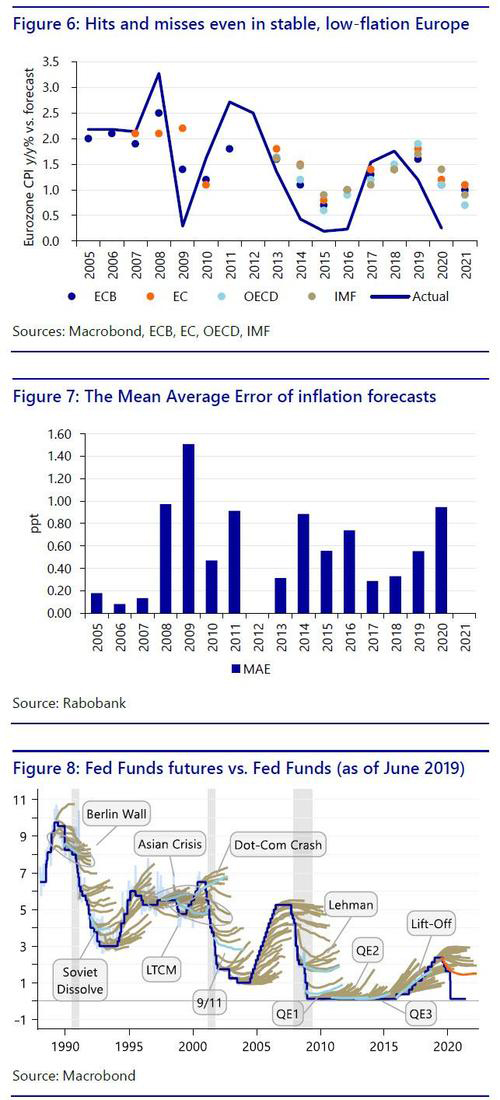
Figures 6 and 7 show the large forecast errors on inflation in the low-inflation and politically predictable Eurozone, as just one example. Figure 8 shows the market forecast of what the Fed was expected to do on interest rates in response to presumed inflation: it suggests that both markets and the Fed are flying blind - or very unlucky! …but we can’t This inaccuracy is rooted in the fact that in an ergodic sense, there is no one accepted, robust theory of how inflation actually works. (Indeed, what do we even mean by inflation - RPI/CPI/PPI? Headline/core? Goods, services, or assets?) For a smattering of examples of the lack of agreement, and in strictly chronological order:
True, there are many areas of overlap in those different theories. Marx’s “fictitious capital” going into asset inflation, not productive investment, sounds Austrian; his “high prices caused by an over-issue of inconvertible paper money” sounds monetarist; polar opposites like Keynes and Friedman agree that inflation can be a stealth tax; and even rivals Minsky and the Austrians share many assumptions about the dangers of credit bubbles. However, there is no unified view of all the intersecting structural causes of inflation that can be modelled - and this is before we include issues such as productivity, and whether an economy is open or closed to international trade - China joining the WTO clearly had an impact on inflation that traditional models failed to incorporate.
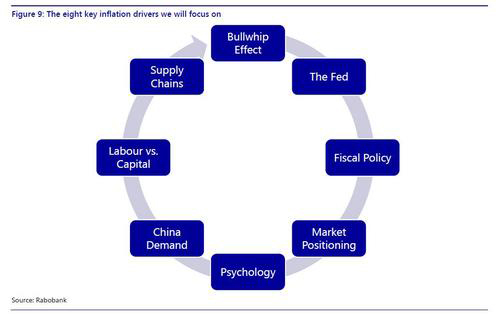
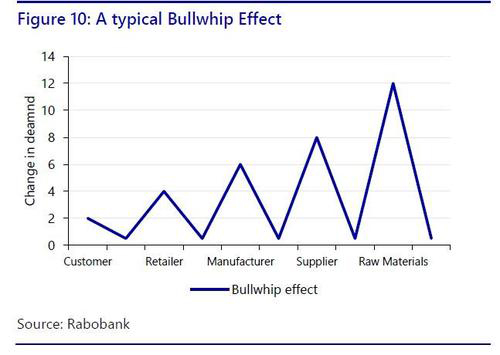
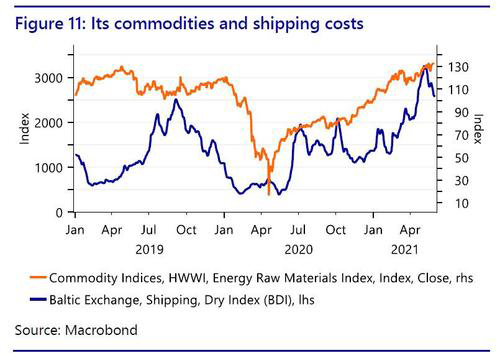
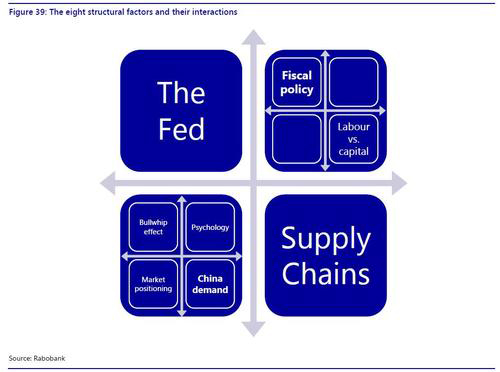
Structural, not cyclicalConsequently, while supply vs. demand is a simple truth, inflation is a multi-faceted, multi-disciplinary, structural phenomena. One can still forecast near-term cyclical changes in inflation with some degree of accuracy, just as for any economic variable with a relatively low level of month-to-month volatility. However, to make accurate long-run forecasts must involve understanding all the structural drivers, and how these can change over time. Here, existing market models fall short. As former Fed Governor Tarullo revealed in October 2017: “Central bankers are steering the economy without the benefit of a reliable theory of what drives inflation.” Indeed, inflation stayed low through the 1950s and 1960s – then surged in the late 1960s and 1970s, proving one set of official inflation models wrong. Inflation was proudly on target in the early 2000s, as we proclaimed ‘an end to boom and bust’ – right before the Global Financial Crisis, which ushered in a new world of inflation persistently below target. As we shall explore, perhaps we stand at another such structural juncture at present. Framework, not a theory; scenarios, not a modelCrucially, this report does not pretend to offer a new holistic theory of inflation, or the belief that we can model it. Instead, we aim to describe what we believe to be the eight most important structural factors currently driving inflation (Figure 9) as a form of framework. These are: the ‘Bullwhip’ Effect; the Fed; fiscal policy; market positioning; psychology; Chinese demand; labour vs. capital; and the role of global supply chains/the distribution of production. We will explore each of these in turn ahead, and will then look at all the permutations of their various interactions, before showing which of the eight matter most, and so could potentially drive a return to global inflation. In short, only one combination of the three key factors leads in that direction – and while unlikely, this is now at least more plausible than at any time in the past four decades. However, as shall also be shown, even having just a few inflation factors does not mean it is easy to make macroeconomic forecast or model. Rather, we will outline just how wide the range of potential global inflation outcomes, and market reactions, still is. 1) Bullwhip Effect Covid-19 and the recent Suez Canal blockage again exposed the weaknesses of our globalized system of production and international trade. Optimized ‘Just In Time’ supply chains are vulnerable to major disruption, just as they were to pre-Covid trade tensions. All have caused severe dislocations in demand, supply, and logistics. In turn, these are causing severe price fluctuations, as can be seen in commodity markets and gauges of producer prices. These are not new market phenomena, but the current scale is extraordinary. The key questions are: i) how long these fluctuations will last; and ii) whether there is now also a structural component. To answer, we need to understand what is exactly going on: enter the ‘Bullwhip Effect’. Asymmetric information In a nut-shell, this occurs when there is an unexpected change in final (downstream) demand, which causes increasingly sharp variations in demand and supply as we move up the supply chain. Think of orders placed by consumers at a retailer, who in turn buys from a wholesaler, who obtains the product from a manufacturer, and so on (Figure 10).
The main cause of these variations is asymmetric information within the supply chain. As no one can entirely foresee the final demand situation downstream, there will be a tendency to rely on the information provided by the nearest customer in the chain. If that information is further limited to simply ‘orders placed’ by direct customers, rather than a reflection of the true state of actual final demand all the way down the stream, this is likely to cause a cascade of demand forecasting errors all the way back upstream. Of course, some of these errors could cancel each other out. Yet when there is a bias to exaggerate orders, perceived demand is likely to be amplified the further we travel up the supply chain. In particular, over-ordering is expected to take place when: i) current inventories are low; ii) prices are low and/or are expected to rise; or iii) the customer is expecting to be rationed by his or her suppliers (i.e. not all orders are likely to be fulfilled). Over-ordering tends to raise prices and, again, more so upstream than in the downstream part of the supply chain. An additional element is the logistics process: transport can be a major source of additional volatility. Bear in mind that it takes time (and therefore money) to move goods from A to B, and in the meantime they are of ‘out of view’ of the production chain, while transport costs can be volatile due to sharp fluctuation in global energy prices.
Although information sharing and electronic data exchange solutions may help to offset some of these Bullwhip issues, it is also clear that a complex global supply-chain with limited infrastructure/transport alternatives raises the risks of asymmetric information issues and logistical chokepoints. A recent World Bank Report points out only a handful of sectors truly drove the expansion of Global Value Chains (GVCs) over 1995-2011: machinery, transport, and electrical and optical equipment. However, many businesses are finding out that even a single, seemingly-innocuous product can nowadays often be the result of manufacturing and assembly in multiple countries. Indeed, even those wishing to buy a garden shed or deckchair --let alone a semiconductor-- are facing long delays and/or price hikes. So how does the Bullwhip Effect work in practice? Here’s a short narrative of what happened since Covid-19 struck:
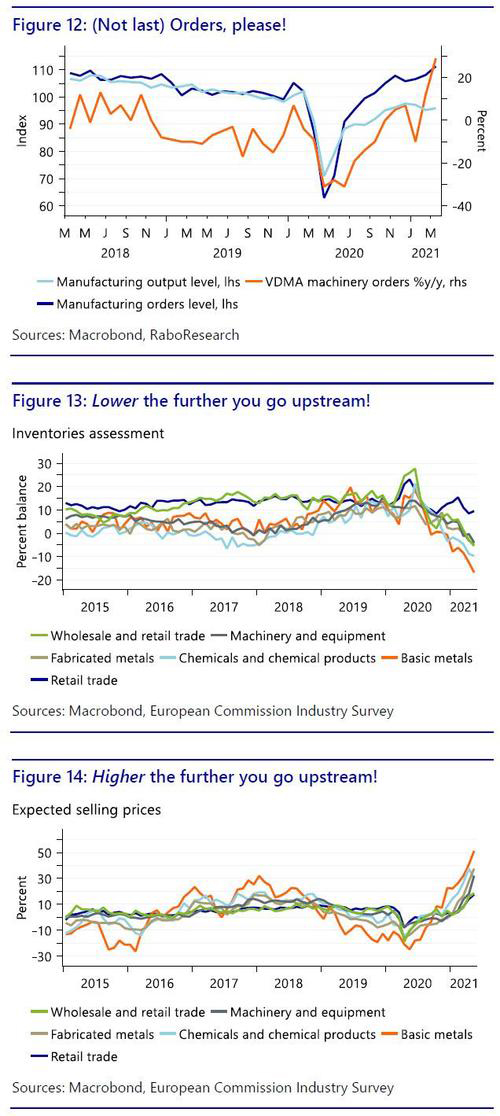
We can illustrate parts of this Bullwhip Effect using German data, firstly because it is a key exporter of manufactured goods, and plays a key role in global value chains. From Q4 2020, orders started to outstrip output, and this gap consistently widened as time progressed; by March, growth of orders for German machinery hit 30% y/y (Figure 12). To illustrate what this does to prices, we show the assessment of inventory levels (Figure 13) and selling price expectations (Figure 14). These clearly illustrate inventories dropped off from 2020 onwards, and were seen as insufficient from the start of 2021. Even more telling is that this effect becomes more pronounced the further you travel up the supply chain. (Assuming basic metals and chemicals are upstream, fabricated metals, machinery, and wholesale are midstream, and retail is downstream). This in turn is translating into the sharpest increases in selling price expectations in the sectors most upstream. In other words, the Bullwhip Effect in practice. So what next? First, past price rises are still working through the supply chain; and given EU and US consumer demand is likely to recover as lockdown restrictions are eased --and if more fiscal stimulus is passed-- the Bullwhip may have more sting in it yet. Indeed, producer prices upstream are likely to filter downstream, so broadening upward price pressures, even if this is a lagging cyclical phenomena rather than a structural one. However, as long as there are still large parts of the world grappling with the virus, we should expect logistics disruptions to play a significant role, suggesting firms will over order ‘just in case’. The closure of Shenzhen’s Yantian port, one of China’s busiest, is an example.
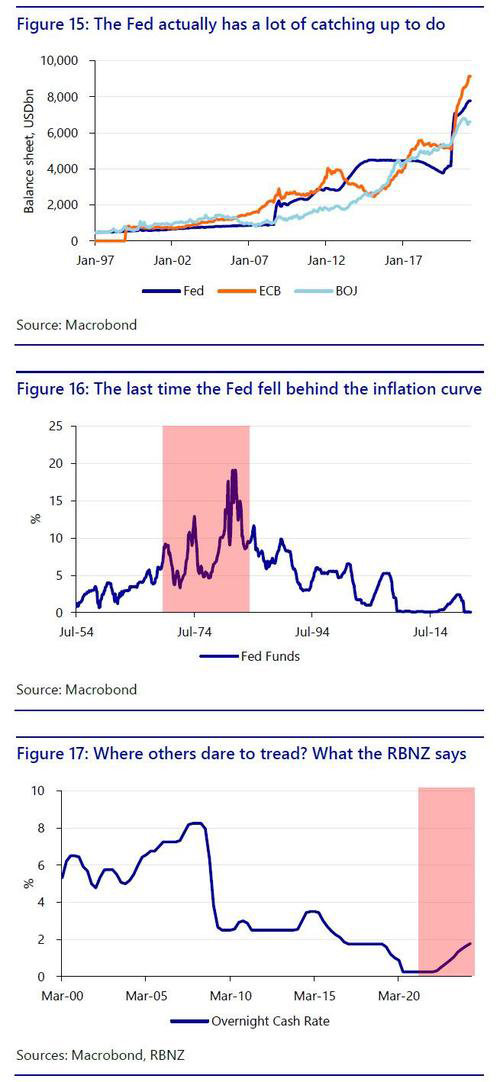
Moreover, global trade flows may continue to face other disruptions, with larger ripple effects. Consider the accident at Taiwan’s Kaohsiung port (14th busiest in the world); protests at US ports; cyberattacks on a key US oil pipeline and major meat producers; and, potentially, the Russian threat to the neutrality of civilian airspace. Meanwhile, geopolitics --which we will explore as part of the final factor driving inflation-- presents a potential risk of the Bullwhip Effect becoming more embedded in markets. 2) The Fed It goes without saying that the central role of the Fed as either enabler or disabler of inflationary pressures cannot be overstated. For the Fed, the inflationary impact of reopening the economy does not come as a surprise. The central bank sees this as a temporary or “transitory” phenomenon which will fade once the economy is back to normal after Covid-19. In its eyes, during the reopening of the economy, mismatches between demand and supply are difficult to avoid. What’s more, restarted supply chains have trouble to keep up with pent-up demand. To add to the distortions, fiscal policy --more on which after this-- is boosting personal consumer spending, while at the same time holding back labour supply through generous federal unemployment benefits (see section 7: Labour vs. Capital). Overall, the official view is that these mismatches between supply and demand in the markets for goods, services, and labour are causing upward pressure on wages and prices. In contrast to the Fed, markets and consumers are alarmed by the economic data and stories about supply bottlenecks, both from the Bullwhip Effect already covered, and the bigger picture geopolitical angle (which will be covered in section 8). These all come at the same time as the base effects that are pushing up year-on-year readings of inflation. Indeed, since we are now comparing the price level of a reopening economy with the price level of an economy in lockdown, we are getting high inflation numbers. On top of that, the demand-supply mismatches, visible in month-on-month data, are pushing up the year-on-year inflation rates even further. No wonder inflation expectations are rising and that bond investors are requiring a higher compensation for inflation. The Fed is pushing back against these expectations by repeatedly stressing the transitory nature of both the base effects and the supply bottlenecks caused by reopening the economy. After all, central bankers think it is crucial to keep long-term inflation expectations in check, because that is supposed to stabilize inflation at central bank target rates. The standard example of what could go wrong is a wage-price spiral, in which consumers demand higher wages because they expect higher prices. In turn, the higher wages will push prices up further, etc. (Again, see section 7). Fed speakers are right in explaining the transitory nature of base effects and supply bottlenecks caused by reopening.
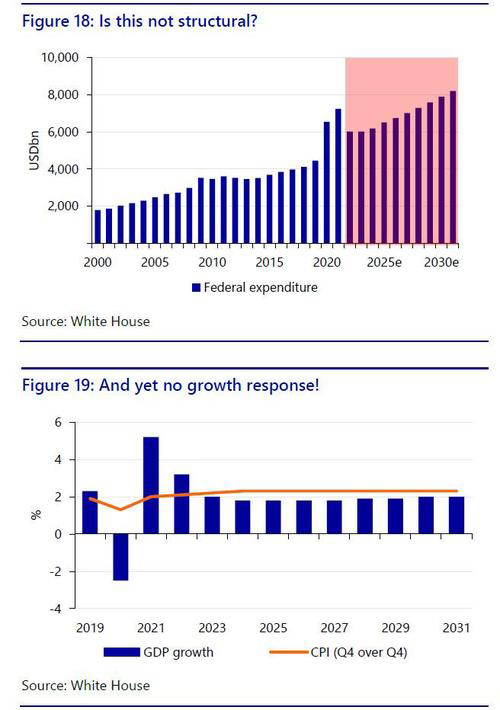
However, we fear they are not paying enough attention to the permanent shifts that are taking place in the global economy. For example, the strained geopolitics of recent years is leading to a rethinking of supply chains. This could have an inflationary impact that stretches beyond transitory. The recent reactions of most Fed speakers suggest that they do not spend a lot of time trying to understand such structural changes, and are still focused on inequality within the US. Worryingly, this means that any permanent impact of these changes will take them by surprise. It could very well be the case that the current monetary policy pursued by the Fed turns out to be far too accommodative, and its reaction function delayed. The Fed decided last year to change its monetary policy framework by shifting to ‘flexible average inflation targeting’ (FAIT). Instead of pre-emptive rate hikes to stabilize inflation near target, they are now willing to let inflation overshoot in order to make up for past undershoots. In other words, the Fed has moved into an extreme position, doubling down on the assumption that the Phillips curve is flat (after years of thinking it wasn’t). The current rate projections of the FOMC imply not a single rate hike before 2024. This means that the Fed will be even more “behind the curve” than other central banks when the permanent shifts in the global economy become visible in the inflation data. What’s more, the US is the country with the most expansive fiscal policy among the OECD, adding to the inflation risk (see the next section). At present, the Fed expects inflation to come down after “transitory” factors fade. However, if the structural changes on the supply side and the demand impulses from fiscal policy cause inflation to remain elevated, the Fed will be caught off guard – and we all know how destabilising for markets this can be. Crucially, we are seeing the risk of the Fed being behind the curve on inflation for the first time since the 1970s. The Summer of Taper Talk In the meantime, we are heading for a summer of ‘taper talk’. The minutes of the FOMC meeting on April 27-28 revealed that a number of participants suggested that if the economy continued to make rapid progress toward the Committee’s goals, it might be appropriate at some point in upcoming meetings to begin discussing a plan for adjusting the pace of asset purchases. Since the FOMC meeting, we have had a very disappointing and then a somewhat disappointing Employment Report, but also a CPI report massively stronger than market expectations, so that much awaited taper talk may be coming soon. Many participants highlighted the importance of the Committee clearly communicating its assessment of progress toward its longer-run goals well in advance of the time when it could be judged substantial enough to warrant a change in the pace of asset purchases. We think if unemployment falls to 4.5% in Q4, as projected by the FOMC, we could see a formal announcement of tapering then. Since Powell has promised to warn us well in advance, we could get a signal in Q3. This time schedule underlines it is about time the FOMC started to talk about what they actually mean by ‘substantial further progress’. The potential risks if they don’t are clear from inflation history. 3) Fiscal Stimulus Once deeply-unfashionable fiscal policy is now very much on trend – and this has huge potential inflation consequences. See here for a recent summary and comparison of relative G20 Covid fiscal packages: but the scale of proposed stimulus ahead in the US makes it the central global inflation focus for markets. US President Biden has already passed the $1.9trn American Rescue Plan, a Covid relief package to support the economy through to September. It contained: $400bn in one-time direct payments of $1,400; enhanced federal unemployment benefits of $300 per week through September 6 (now being rolled back in some states); $350bn to state and local governments; and an expansion of the child tax credit from $2,000 to $3,000. Following on, Biden has presented three other huge fiscal proposals. The American Jobs Plan offers $2.3trn in spending on social and physical infrastructure out to 2030. The largest item is transportation, including electric vehicles, bridges, highways, roads, public transit, and passenger and freight trains. The plan also supports manufacturing, including US production of semiconductors, as well as green energy, buildings, and utilities; R&D and training; upgrading and building new public schools; and large-scale home- and community-based care for the disabled and elderly. The American Families Plan proposes an additional $1.8trn on health care, child care, and poverty reduction. The fiscal 2022 budget (starting 1 October) proposes federal spending of $6.0trn compared to $4.4trn in 2019, even though the economy should be fully re-opened. Spending is also projected to keep rising to $8.2trn by end-2031 – double what it was before 2017, and 33% above 2022’s level. As such, federal debt will exceed the historical post-WW2 peak within a few years and hit 117% of GDP by end-2031, vs. around 100% of GDP now. In short, we are in a new structural paradigm on the political will for higher federal expenditure. On taxation, the White House initially proposed to raise the corporate rate to 28% from 21%, double capital gains to 39.6%, increase top income tax to 39.66%, let the Trump tax cuts lapse when they expire, and ramp up IRS enforcement. Notably, all of the taxed groups have a lower marginal propensity to consume than those who would see higher federal spending, so this redistribution of income would benefit consumer demand. Remarkably, the economic projections in the budget do not expect a surge in US growth from all this federal spending.
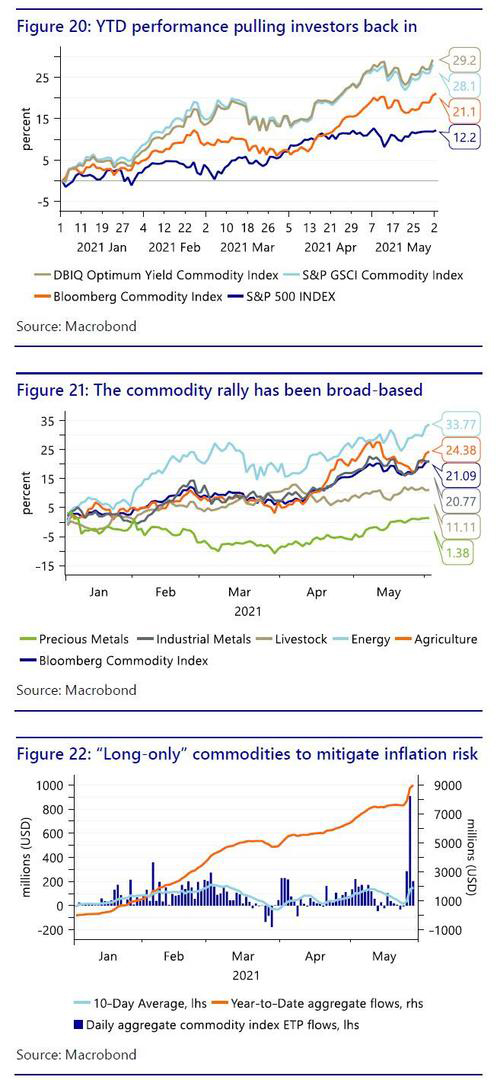
Real GDP growth is seen averaging 2% y/y through to 2031, compared to 2.3% from 2010-19. Moreover, inflation is expected to stay moderate at just 2.3% y/y despite the current evidence suggesting that such a surge in fiscal stimulus into a log-jammed logistical network would produce a more pronounced Bullwhip Effect. The key issue now is if these measures can pass Congress. The Democrats’ preference for using Budget Reconciliation to get bills through the 50-50 Senate, with the Vice-President holding the decisive vote, has been complicated by the Senate parliamentarian. The issue is also putting pressure on relations between progressives and centrists in the Democrat Party: Senator Manchin in particular has repeatedly said he does not believe reconciliation is appropriate, and prefers bipartisan legislation. Therefore it remains to be seen how much of this fiscal agenda will materialize before the mid-term elections in November 2022, which could then change the Congressional balance of power. For markets, this is a critical issue – but it requires political, not econometric forecasting skills! 4) Market Positioning A further factor playing into inflation fears, and arguably both reacting and driving it, is the role of financial markets and their positioning. Commodities are one of the best performing asset class year-to-date, registering gains of 21% to 29% depending on which index you look at (Figure 20). The commodity rally has been broad-based in nature, sparking widespread inflation fears. Unsurprisingly, commodity futures returns are positively correlated with the US CPI index, which is also currently spiking, and especially energy markets, given the high pass-through cost to consumers. As such, investors and large asset managers are increasing commodity index exposure to mitigate inflation risks across their portfolios with nearly $9bn of inflows or “new” money into the commodity ETF space alone (Figure 21). These figures are only what is publicly available, but the trend is clear: commodities are back in vogue as an asset class. Indeed, the true sum of investor inflows is likely multiplies of what is shown here when considering the less transparent investment vehicles such as privately managed accounts and hedge funds. In fact, assets under management at commodity index funds (ETFs and mutual funds) remain significantly below the highs from the early 2010s, suggesting we are still in the early stages of a strategic rotation. This potential buying pressure is likely to keep a strong bid under commodity prices, creating a positive feedback loop with inflation fears. Admittedly, we have seen some hedge funds and large speculators scale back “long” positions in recent data. However, there are key distinctions amongst the different group of large commodity speculators as it relates to their trading behaviour and motivations. The scaling back in positions seen so far has been more related to systematic and even discretionary “long/short” traders. These flows typically have little to do with inflation, and more to do with momentum, trend, and carry signals on the systematic side, or on commodity-specific fundamentals for discretionary traders - which remain bullish in many cases. On the other hand, we have the phenomenon of commodity index investors, a distinct class of speculators who were dormant up until recently. This category of investors is comprised mostly of institutional money such as pension funds and large asset managers, who are investing in “long-only” commodity indices for the specific goal of mitigating inflation risks to their portfolios.
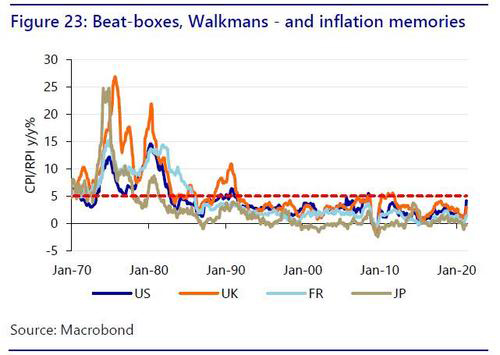
As such, their investment dollars tend to be much “stickier” than other groups of traders, who are constantly moving in and out of markets. These inflation-based flows have remained very strong, and late May saw a record inflow of over $1bn (Figure 22). This could soon see the reduction in positioning from the “long/short” crowd reversed, leading them into forced buy-back positions at higher prices – something we may already be seeing in grains markets aside from weather-related developments. 5) Psychology Very high --or low-- inflation can exacerbate socio-political problems, as many of the inflation quotes on the first page underline: it is an intensely political issue. Moreover, it can even produce a change in national psychology. The German Weimar Republic and its early 1920’s hyperinflation serves as an infamous example that still leads Germans to fear inflation and lean towards ‘sound money’ and fiscal prudence. Of course, we can remember things wrong: this focus on inflation overlooks the subsequent, deliberate crushing Weimar deflation of 1929/the early 1930s, which was more clearly the path leading to Nazism. Current socio-political tensions and rising populism are widely recognised by politicians and central banks alike. A period of sustained high inflation that hits the poorest in society the hardest should be extremely concerning. Fortunately, most OECD economies have not seen sustained high inflation for a generation, e.g., CPI (or RPI) was last above 5% in the US and Japan in the early 1980s; in France, in the mid-1980s; and in the UK, in the early 1990s (Figure 23). However, this is also a problem. To have been an adult (21 or over) with working experience of high inflation one would today have to be aged over 60 in the US and Japan; over 55 in France; and over 50 in the UK. Even in China, an emerging market which has seen more recent bursts of inflation, one would have to be aged over 30. Anyone younger working in markets or at central banks has spent their career without serious inflation. Or, to put it another way, they are experienced in fighting a phony war rather than a real one. As such, one must ask if OECD markets are psychologically prepared for higher inflation, were it to occur.
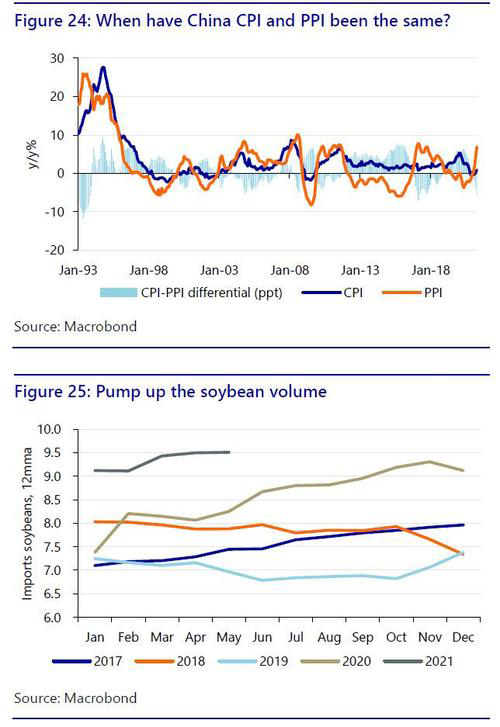
On one level, this means inflation is less likely, as it is simply not ‘on our radar’: we don’t expect to see it last. Yet equally, after decades of low inflation, it is unclear what a sustained reversal might do to business and consumer behaviour, if seen. In emerging markets with persistent inflation problems, such as Argentina or Turkey, there are preferences for hoarding hard assets or hard currencies; indexing rents to the USD; repaying loans or accounts outstanding slowly, as the real value of debt deflates; spending money as soon as one has it; and against long-term business lending or planning. In Western asset markets such as residential property, one can also witness the assumption that “prices always go up”, and what that does to consumer behaviour. Should we see that dive-in-and-hold attitude flow back to a broader basket of goods and services, it would be deeply concerning. It would also exacerbate the Bullwhip Effect already mentioned. As already shown, breaking the entrenched (Keynesian) inflation psychology that had developed in the West over the late 1960s and 1970s required a period of exceptionally high nominal rates under the Volcker Fed, and major structural economic reforms that deregulated the economy. Today, there is no social or political appetite for either – if anything quite the opposite is true as we shift away from raw globalisation. So how could we fight it, if we had to? That again leaves one wondering exactly what businesses and consumers would do if they began to suspect that those in charge of inflation were abdicating that responsibility. The huge shift of interest towards crypto assets, rather than productive investment, may be part of the answer – and not a happy one. Of course, both Fed Chair Powell and US Treasury Secretary Yellen are old enough to recall the Volcker Fed and what preceded it. "I came of age and studied economics in the 1970s and I remember what that terrible period was like," Yellen told Congress in testimony. "No one wants to see that happen again." Moreover, an influential, growing slice of the OECD population --pensioners-- would stand to lose out hugely from high inflation. Yet while it is good to have leadership able to recognise the damage from high inflation, it remains to be seen if just not wanting to see a repeat of the 1970s is enough: most so when key structural assumptions are changing, and the US Treasury is --accurately-- using 1970s terminology like “labour vs. capital”. 6) China Demand Though many tried, it has long been impossible to discuss global inflation without also discussing China. This was true in 2004, when Chinese nominal GDP was $2.2trn and its export engine was driving the global cost of manufactured goods down to the “China price”; and it is even truer today when the still-growing $15.4trn Chinese economy is an even larger exporter – and an importer of many commodities at a time of rising commodity price inflation. Of most immediate cyclical concern is the risk of Chinese PPI (rising 6.8% y/y) feeding through into CPI (0.9% y/y) and hence on into imported inflation around the world. However, China has seen previous cycles of PPI-CPI divergence, and they have not so far proved to be inflation events for global markets as much as margin crushing ones for Chinese firms (Figure 24). They may well be again.
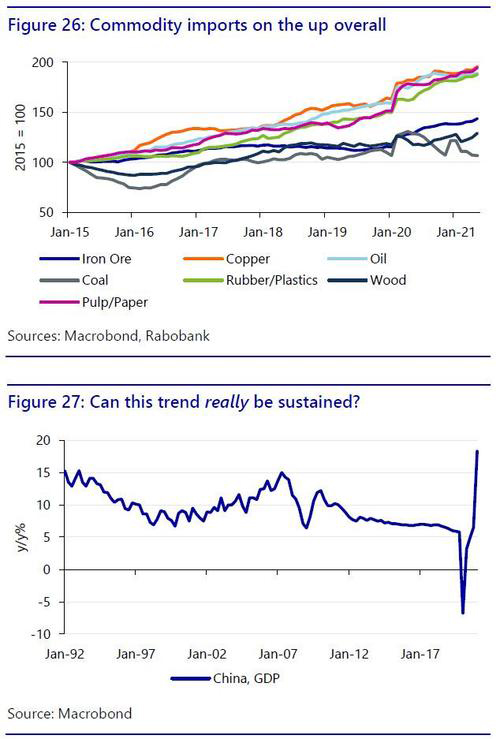
From a structural perspective, we must also focus on Chinese imports. There has been a surge in commodity import volumes in 2021: is this really demand-pull, translating into global cost-push inflation, and so meaning central banks are wrong to think the inflation we are now seeing is “transitory”? Is China now inflationary not deflationary? In the agri space, this is our long-held view, and has been exacerbated by problems like African Swine Fever. China’s May 2021 soybean volumes are up 36% over May 2019; wheat 262%; corn 339%; barley 80%; and edible oils 76%. This is clearly inflationary for the rest of the world, if maintained. However, how about the broader commodity picture? First, the import volume picture is almost as extreme across a range of hard commodities, but also including the likes of pulp/paper (Figure 26). This is happening despite the fact that GDP growth --looking past the distortions of 2020-- is still on a declining trend (Figure 27), and as the shift to a services economy continues, so China should logically be moving towards lower commodity intensity. So where are these commodity imports actually going, and is this surge in import demand sustainable? They are questions of the highest global importance.
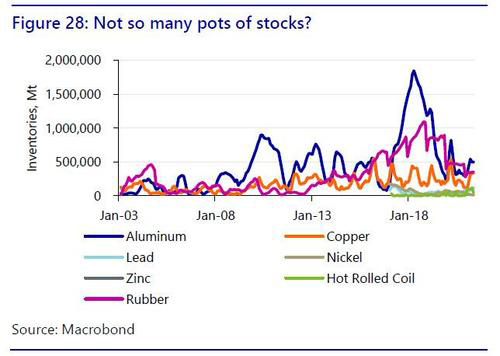
Inventory data for key hard commodities, while rising, are generally below previous peaks (Figure 28), which suggests imports are finding final demand – although the reliability of such numbers has been called into question in the past, most notably with the ‘rehypothecated’ copper scandal in 2014.
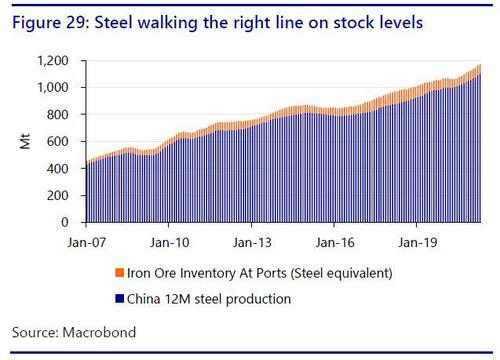
Chinese steel production vs. the iron ore inventory held at ports also does not suggest excess stocks are being built up (Figure 29).
Rather than ask what each individual commodity is doing, the key question in terms of global inflation then becomes where this Chinese demand is being seen – and the answer appears to be three-fold: construction, exports, and speculation.
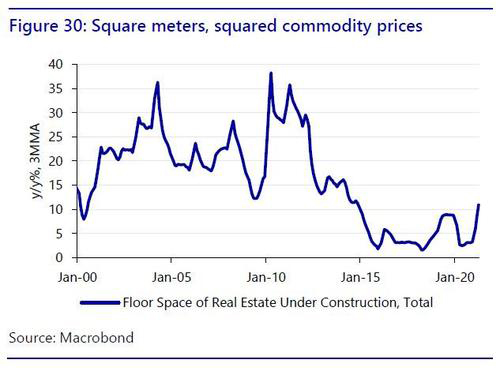
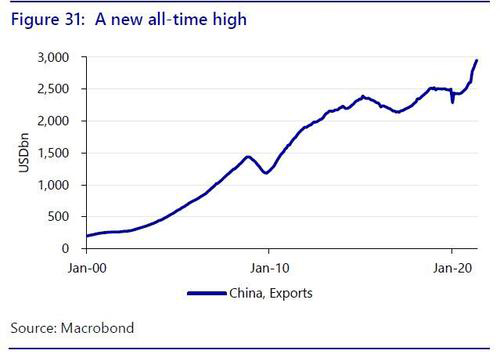
Construction area was up 10.9% y/y on a 3-month average in April (Figure 30), the highest reading since late 2014. On exports the picture is also obvious (Figure 31) and is arguably responsible for much of the demand for pulp/paper, rubber, and plastics, etc. However, from an inflationary perspective if these goods were being made elsewhere, there would still be the same commodity demand – just more geographically dispersed.
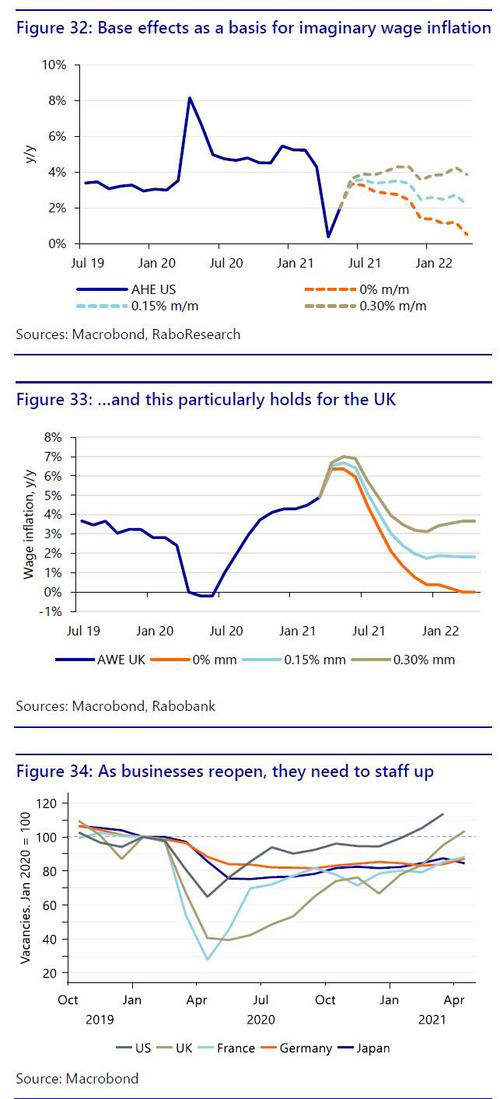
Finally we have speculation, which is not reserved to US funds. Chinese authorities have recently intensified a campaign to prevent such activity pushing commodity prices higher. The government has vowed “severe punishment” for speculators and “spreading fake news”, and stated it will show "zero tolerance” for monopolies in spot and futures markets, as well as any hoarding. These announcements saw an initial knee-jerk move lower in many commodity prices on Chinese exchanges. However, unless GDP growth --and construction-- slow, which does not appear politically palatable to Beijing, then ultimately demand for commodities, and speculation to chase it, are likely to return again. Of course, high prices themselves could destroy demand. Anecdotally, copper prices (up 47% since the start of 2020 and 23% since the start of 2021) are causing significant problems for many related firms in China. A related factor is the currency. The PBOC has made clear it is not willing to allow CNY to appreciate to dampen imported commodity inflation: indeed, this would arguably exacerbate it as demand would be able to stay high. Conversely, a weaker currency would help cap demand via higher prices – but would be deflationary for the world and suggest a de facto ‘speed limit’ for Chinese growth: it is unlikely that the PBOC would be prepared to flag that. In short, cyclical fears of a China-to-global inflation pass-through are overstated; but unless we see a shift towards lower Chinese growth, its increasing commodity appetite still risks a structural shift higher in cost-push inflation outside the agri sector, as well as within it. 7) Labour (vs. Capital) For years, markets expected inflation and bond yields to rise: and for many years we said those forecasts would be wrong – and were consistently right. This is because the political-economy Marxist/Post- Keynesian/Minsky view of the importance of the bargaining power of labour is not incorporated into inflation models. They look at an expansion of money supply, or credit, or QE, and assume it will filter through to wages. An atomized workforce in a globalised, financialised economy says it will not – and Covid-19 has only increased these pressures. However, when the US Treasury Secretary is talking about labour vs. capital(!), Western governments about ‘Building Back Better’, and central banks are focused not just on inflation and unemployment, but inequality, we might potentially be on the cusp of a structural break that would have enormous implications. On the other hand, cost-push inflation pressures will collapse under their own weight if wages don’t follow. This all makes the wage outlook crucial. Nonetheless, most of these data are being affected by temporary factors such as composition effects. Many low-paying service jobs were shed or furloughed during Covid-19, for instance, which pushed average pay up, and most so in the more timely and ‘market relevant’ metrics, such as average hourly earnings (AHE) in the US, or average weekly earnings (AWE) in the UK. Further out, this composition effect may start to act as a drag on wages. Once employment in service industries fully recovers, the increased relative weight of these wages will pull down the average again. This even holds when wages for these workers exceed their pre-pandemic trend. On which note, wage inflation will first appear to rise sharply over the next few months due to these effects, adding to an already combustible mix of inflationary signals. Yet this will happen regardless of the underlying strength of the labour market (see Figures 32 and 33). In the UK, for example, y/y wage growth could spike to as high as 7% before falling back as these effects fizzle out. Meanwhile, in many countries customers are coming back to shops, restaurants and other establishments faster than employers are able to add staff at prevailing wages (Figure 34). In the US, employers are competing with generous unemployment benefits in some states, while health and childcare issues may also be keeping people out of the workforce. In Europe, employees are shielded by the security of furlough schemes. Australia has just begun to phase these out; the UK will do so from July to September.
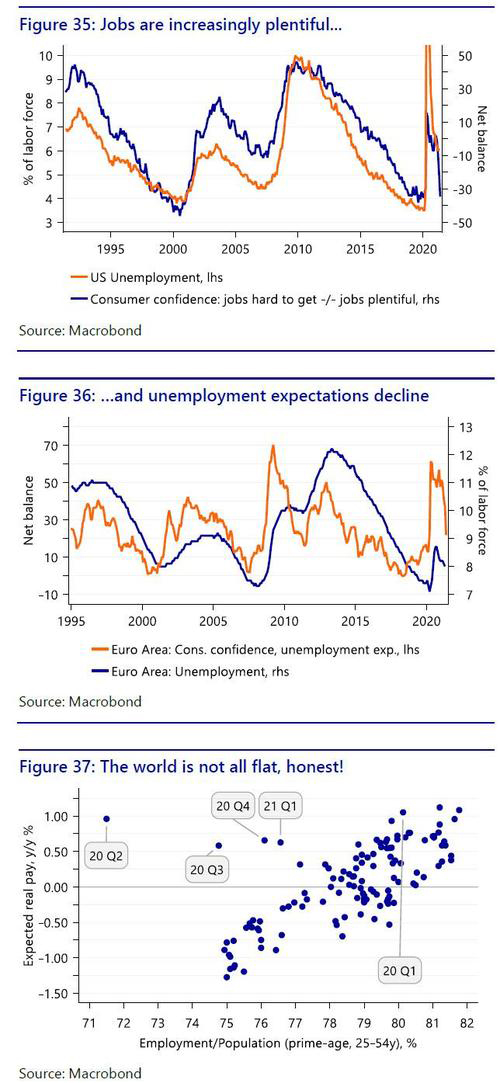
Importantly, these are temporary factors, suggesting no real motivation for employers to pay structurally higher wages than previously, and they would be better off offering one-offs or sign-on bonuses instead: anecdotally, this is exactly what is happening: some US states are paying ‘return to work bonuses’ of up to USD2,000; US restaurants are offering adjusted hours and gift cards; and UK restaurants are giving finders’ fees of GBP2,000 for workers who bring a friend to fill an empty position. Of course, leisure/hospitality wages are far lower than in other sectors, and we therefore think it is unlikely that there will be a spill-over. Indeed, the opposite didn’t happen in March-April 2020: even as 7m US leisure/hospitality jobs were lost this had no effect on wages in construction, manufacturing, or other services. In short, US job vacancies are rising to new record highs (Figure 35), but this reflects a resumption from locked-down services activities rather than an overall extremely-tight labour market that can drive up wage expectations. However, this does not mean there are no such risks ahead. First, the labour market is likely to heal far faster than after the GFC. Due to extensive state support measures, ‘scarring’ effects aren’t as extreme, and most furloughed workers will eventually be reintegrated into the labour market. Indeed, even as measures of unemployment are being depressed by the drop in participation rates, surveys suggest the recovery to pre-pandemic unemployment rates will be rapid. We currently forecast US unemployment to be below 4% in late-2022, and Euro area unemployment should stabilize at 8.5% before it eventually starts declining too (Figure 36). Admittedly, the NAIRU --the unemployment rate trigger for higher wage inflation-- hasn’t been a useful forecasting tool for years, for reasons we already covered. However, pre-Covid there had already been signs of wage inflation beginning to reappear. Indeed, one of the few iterations of the US Phillips Curve that actually has a slope (Figure 37) suggests if the recovery in prime-age US employment continues to progress at a solid pace, real pay growth will remain positive. Likewise, in the Eurozone, the cyclical component of wage growth may also become more relevant once things have normalized. But then we come to wild card: politics, and the structural changes it may bring. The back-to-work bonuses being seen in the UK and US may not be structural wage-inflationary – but they are a clear indication of just how much wage-inflation the ‘Built Back Better’, full-employment economy aimed for by proponents of fiscal stimulus, or MMT, would imply. Is this where we are heading under the present seemingly irresistible force of a labour-friendly zeitgeist and massive fiscal stimulus? If so, there will be huge obstacles from -- and equally huge implications for-- global supply chains, the last inflation factor to be covered. Or will globalisation prove the more immovable object, with white collar middle class jobs sent abroad now that remote working has become normalised, as some believe may occur?
In short, if forecasting inflation requires forecasting wages, then forecasting wages requires being able to forecast the outcome of political-economy. No model is able to do so – but the risks of a structural break towards labor and away from capital, while low, appear higher now than at any point in the past four decades. That alone makes it even more imperative to look at the wage/earnings data – and political developments. 8) Supply Chains Supply chains are vitally important in any inflation framework for three reasons: one deflationary, and two inflationary:
The US-China trade war, followed by the Covid crisis and the obvious shortfalls of PPE, ventilators, and vaccines (and then the Suez Canal blockage), has seen growing official recognition that ‘just in time’ production needs to shift to a more ‘resilient’, ’just in case’ model. The deepening US-China Cold War makes this ideological for some as well. Yet even for those who do not wish to be involved in this issue, supply chains are intimately linked to any plans to ‘Build Back Better’ and/or for Green transitions, which are now common. For example:
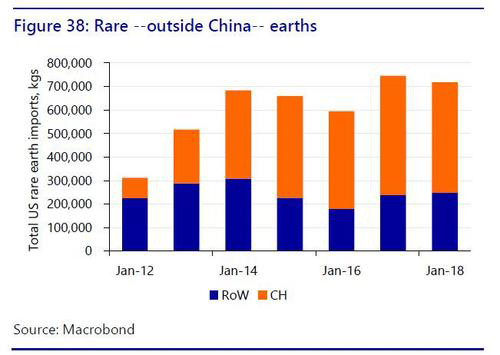
Cynics will point out talk - like imports - is cheap. However, the shift towards fiscal policy is clear; many Western politicians recognise not just their leadership, but the liberal world order is under pressure; and this all now being linked to ‘Green’ is significant. It holds the promise of securing our safety, and higher economic growth, better employment, and a commanding position in an uncertain future of climate, social, and geopolitical change, which echoes the 1950’s Space Race. Everyone wants to produce the industrial goods of the future, like electric vehicles, batteries, and solar panels. Yet it should also be obvious that it is not possible for the US, China, the EU, Japan, the UK, etc., to all ‘Build Back Better’ with Green domestic production without global decoupling; nor for all to be net exporters. As such, this threatens a new (or rather, old) global paradigm: instead of businesses seeking the lowest cost production anywhere, they may have to seek sustainable production --with social and national security parameters-- closer to/at home. Geospatially, this means no more hub-and-spokes focus, but a distributed, multi-modal approach around economic centres of gravity able to bend Green rules of trade/regulation to their advantage. Of course, globalised businesses will not like this, and most are so far ignoring missives from their governments to bring supply chains and jobs home. However, a mixture of carrots (fiscal incentives) and sticks (tariffs and/or non-tariff barriers) could move production, as we already see. Yet things are even more complicated than that. Even if a factory is opened in the US, the Bullwhip Effect shows it can be rendered useless without a reliable supply of all the intermediate goods and raw materials needed for final assembly. China has built this at home and along the Belt and Road Initiative (BRI) to coax foreign production to agglomerate there. 75% of global solar panels are now made in China, for example, and it intends to dominate Green production. Indeed, new US electric car battery plant would need lithium, nickel, cobalt, and copper – but can supply be assured? Consider the potential for China to disrupt crucial rare-earth mineral exports required for electronic goods production (Figure 38); and what is happening with US restrictions on much-needed high-tech exports to China. The US or Europe would arguably need to replicate what China has done all the way down the supply chain --in a zero-sum game-- to ensure true ‘resiliency’. On that note, the June 2021 G7 summit will include a commitment to a Green (democratic) alternative to China’s BRI. In short, our commodity-price inflation sits alongside a global ‘race for resources’ that mirrors the late 19th century – when mercantilism (and empire) was fashionable. That implies huge structural shifts in supply chains - and a flow-through to labor markets.
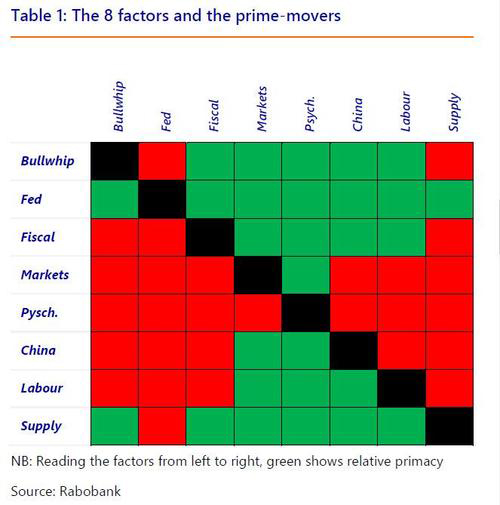
Into this mix we also see flux over reserve currencies, central bank digital currencies (CBDC), and payments systems. China has already launched a pilot CBDC; and the ECB has argued a CBDC might facilitate digital “dollarisation” (or “yuanisation”?) in weaker economies, while strengthening the global status of the currency in which the CBDC is denominated. The ECB openly flags concerns over domestic and cross-border payments being dominated by non-domestic providers, where “individuals and merchants alike would be vulnerable to a small number of dominant providers with strong market power”. This all presents the tail-risk of a global bifurcation of technology, production, payment systems, currencies, and supply chains - and labour markets. Moreover, if we do move in that direction, it will not be a gradual, linear process like a series of snowballs to be dodged: it will be a tipping-point to a rapidly exponential process, like an avalanche. Of course, none of this may come to pass: but that does not mean that the zero-sum game goes away. Somebody will still get to ‘Build Back Better’ with domestic production; somebody will produce the Green goods required; somebody will have reserve currency status globally; and somebody will have the easier access to raw materials and logistics supply chains required to do all of the above. Yet it may not be all the same economy or currency. As we will now show, global inflation will depend on how this all plays out, alongside the other seven factors previously listed. Whipping into a (new) shape We have just shown the eight primary factors we see driving global inflation. What we now need to do is look at how they interact. Let’s begin by making a simple assumption: that each of the factors can have a binary state that is either inflationary (1) or deflationary (0). As such, there are 64 potential combinations. That can’t be modelled, and we won’t try. But we can weigh up which factors have logical prime-mover status --or ‘primacy’-- over the others. This can help us complete an inflation framework. Let’s take factor #7 (Labour) and factor #2 (The Fed). Both are crucial to any understanding of inflation pressures. If labour is in a strong bargaining position, e.g., if supply chains are being on-shored, then higher inflation would appear. Likewise, if the Fed were to fall behind the curve on rates, inflation would rise. However, can a tight labour market prevent the Fed from raising rates and bringing inflation --and wage inflation-- down? No, as Volcker showed in the early 1980s. The Fed may opt NOT to act on rates, but it cannot be prevented from doing so by unions - unless US politics changes completely. In short, the Fed has primacy over labour. Let’s look at factor #6 (China) against factor #5 (Market Positioning). Market positioning can push commodity prices higher, and so can China. But if China stopped buying, prices would fall and market positioning would shift. On the other hand, if markets kept pushing prices higher China may not like it, but it would not necessarily have to stop buying. In reality, it would probably do to markets what markets can’t do to China: regulation. So China has primacy. Another example is factor #8 (Supply Chains) against factor #1 (Bullwhip Effect). Both are inflationary, but one is prime. A shift to a new supply-chain system might replicate a Bullwhip Effect to begin with: but after that it would help prevent one from happening. The opposite does not hold true. So supply chains have primacy over inflation trends. How about factor #3 (Fiscal policy) and #2 (The Fed) – there is a prospective clash of the titans! Again, only one matters most. If we were to see loose fiscal policy, monetary policy can be tightened in response to reduce inflation pressures. On the other hand, Congress could not keep spending or cutting taxes to compensate for rising rates - unless US politics changes completely. As such, the Fed still holds primacy. Then we come to perhaps the most interesting one: factor #8 (Supply Chains) against #2 (The Fed.) Imagine we see the tail-risk supply-chain shift scenario unfold: Western unemployment tumbles, and broad wage inflation matches that being seen in the return-to-work bonuses of the furloughed US and UK services sectors. The Fed cannot encourage firms to offshore - but it can stop some of those jobs from being created by raising rates and slowing the economy and/or pushing the dollar higher. So returning supply chains cannot force the Fed not to act – unless US politics changes completely, as under a new Bretton Woods with capital controls, for example. As such, the Fed once again has primacy. Meanwhile, what the Fed ‘has’ to do because of supply-chains is unclear. It is possible to run a trade surplus without high inflation as Germany, Japan, and China all show – but it seems unlikely the US can shift economic structure to this degree. Table 1 uses the prime-mover lens to show only two factors emerge as truly crucial for global inflation: the Fed, and supply chains
This doesn’t mean US fiscal policy is not vital – it also is. But more so is what the Fed does in response; and if the White House starts to shift global supply chains. Figure 39, on the next page, is an adjusted version of Figure 9 that better reflects the relative importance of each of the eight interacting factors we have covered so far.
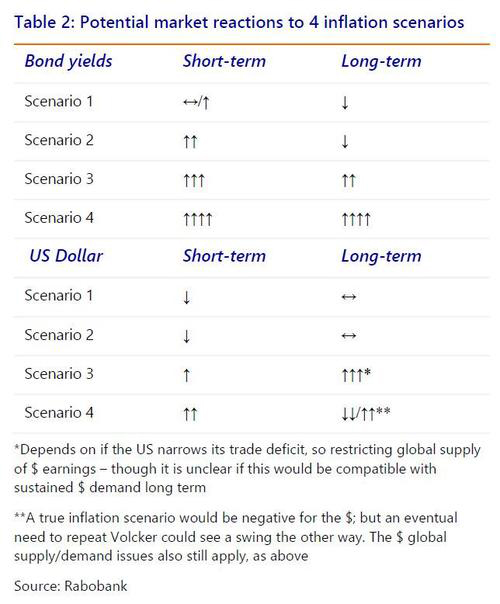
Does this give us an inflation forecast? Again – no! One has to forecast what Congress will do, what the Fed will do in response – and what the White House does on supply chains. That is two political forecasts and a monetary one that is more political too. What can say from the framework, however, is that the inflation outlook shifts enormously depending on these projected outcomes. Indeed, we can draw up 4 scenarios focusing on the most important factors of Fed, fiscal, and supply chains:
Meanwhile, the implications vary for the EU and China (and the rest of the world). US inflation, or deflation, would flow through to them. Yet scenario 3 would be deflationary for net exporters to the US (see Figures 40-43 as a summary).
NB In the Figures above, green denominates that a factor is overall deflationary, and red denominates it is overall inflationary. The key two/three factors (the Fed, fiscal policy, and supply chains) are highlighted to underline their relative importance. On the right side one sees the indicative near and longer term inflation outcomes for the US, EU, and China, as well as the trade impact. The latter is indicative that without a shift in supply chains, fiscal stimulus flows to production abroad and not at home so ‘Build Back Better’ is built elsewhere.
NB Figure 42 shows that while each factor for inflation is generally red or green, a shift towards fiscal and monetary stimulus, and a supply chain shift could not help but strengthen the power of labour vs. capital. However, the extent to which supply grows faster than demand, and productivity, would then be key. At the same time, Figure 43 underlines just how destabilising all factors shifting back in an inflationary direction at once would be! ‘Whipping’ markets aroundCrucially, in each of the four given scenarios, inflation rises near term – which we already see around us; and more so with each additional inflation factor that flips red. In scenarios 1 and 2, inflation falls back again subsequently because labour does not have any bargaining power, and extra demand is met by offshore rather than onshore supply. This is “transitory” inflation – yet it means significant pain for consumers and businesses. The difference between no fiscal stimulus and fiscal stimulus is also hugely significant near-term, with scenario 2 pushing inflation much higher with a much larger Bullwhip Effect (and so real wages lower). Yet it is only a shift in supply chains --‘Made in America/Buy American’ policy, and/or US, EU, or UK tariffs on others’ Green goods-- in tandem with fiscal and monetary stimulus that sees a sharp move higher in inflation near term, and a structural long-term shift higher. At that point, should labour power and mass psychology also change in an inflationary direction, as in scenario 4, then even a partial mirroring of the 1970’s experience is theoretically possible. In terms of the potential impact on bond yields and the US Dollar, we therefore have the following hypothetical outcomes – and one can see how wide a range there is:
Conclusion
If this implied volatility fails to satisfy a market looking for a simple, cyclical answer to its $64 trillion structural inflation question, then one needs to get cracking. First, on understanding political economy at a national level - which would have predicted the recent structural change in the Fed’s reaction function; and second, on understanding geopolitics/geoeconomics/great power theory at an international level - which would have predicted the current Cold War, and the ensuing push for supply-chain decoupling. We could also have just looked at history, and noticed how inflation never remains in the nice, stable range we would like it to for too long - because underlying social and economic structures don’t stay the same, even if our models do! Or, we can take an even bigger picture view than that:
|
Send this article to a friend:
 |
 |
 |


![[Most Recent Quotes from www.kitco.com]](http://www.kitconet.com/images/live/s_gold.gif)
![[Most Recent USD from www.kitco.com]](http://www.weblinks247.com/indexes/idx24_usd_en_2.gif)
![[Most Recent Quotes from www.kitco.com]](http://www.kitconet.com/images/live/s_silv.gif)