
Send this article to a friend:
May
24
2021

|
Send this article to a friend: May |
|
Happy Anniversary, Taper Tantrum
Issue #1: What are US markets trying to tell us? It would be tempting to say “Nothing” … That we’re only 3 percent off the S&P 500’s record close of 4,233, set all of 8 trading days ago. That there’s plenty of good news to come. That Europe is just now reopening … All these are true, but they are also broadly known and therefore already in asset prices. The way we see it, the real issue simply is that US equities are seemingly priced for perfection in a world that investors know will always be imperfect.
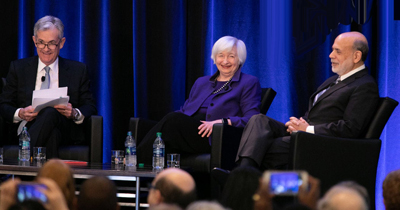
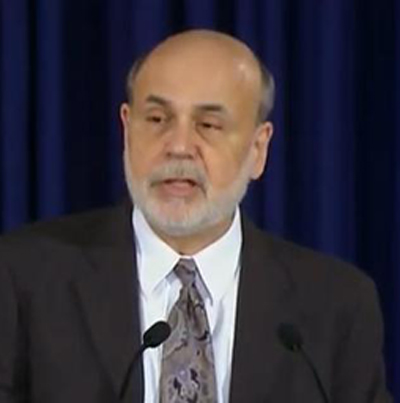
Takeaway (1): as we’ve been discussing with you recently, seeing an S&P 500 materially higher than today at the end of 2021 is a tall order. Three years of double-digit gains are relatively rare in the historical record, and we’ve just had 2 (31 pct in 2019, 18 pct in 2021). Year to date the S&P is up 9.7 percent, and it has stalled out every time it has breached a 10 percent YTD gain. We remain optimistic on US large cap (but not small cap) equities because we believe earnings estimates are too low. But we’ll repeat our message from last week: if you want to lighten up on equity exposure here, history is on your side. Takeaway (2): if you’re of the mind to trade this market, then watch the CBOE VIX Index for reasonable entry points. The numbers to look for are 28 and 36-40. These are 1 and 2 standard deviations from the long run mean, and VIX closes at/above these levels have been a good entry point over the last year. Takeaway (3): we’ll remind you of our “5 percent rule”, namely buy every S&P 500 close where the index sees a 5 percent one-day decline after the first such drop. See the first one, don’t buy it. See the second, third and so forth – those are your opportunities for buying when there’s the proverbial “blood in the streets”. This approach worked well on a one-year forward basis both in 2008/2009 and 2020. * * * Issue #2: The latest money flow data for US-listed mutual/exchange traded funds as a barometer for retail investor confidence in asset prices. (Information courtesy of the Investment Company Institute’s weekly flows report). The key fact about the most recent data (week ending May 12th) is that fund investors are back to buying US equity funds. Last week saw $9.7 bn of inflows into these products, and the prior week had $5.1 bn of inflows. That puts the MTD total at $14.9 bn, enough to offset April’s $7.8 bn of outflows. February and March flows were both strongly positive ($45 bn, $53 bn), so for the moment we’re back to seeing fund investors embrace US equities. Also notable in this week’s flow data: commodity funds (mostly physical gold) are catching some retail investor interest again. Inflows totaled $1.1 bn for the week ending May 12, following on from $550 mn of inflows in the prior week. We see that as consistent with increasing investor concerns about inflation and, as mentioned in last night’s note we do like gold as a hedge against rising prices. * * * Issue #3: The 2013 “Taper Tantrum” – a brief history. How it started (8 years ago this Saturday): At a Congressional hearing on May 22, 2013, then-Fed Chair Bernanke said in response to a question: “If we see continued improvement, and we have confidence that it is going to be sustained, in the next few meetings we could take a step down in our pace of asset purchases.” This was the first time the Fed had discussed tapering, and it wasn’t even in Bernanke’s prepared remarks of that day. Important: The Fed then spent the rest of the year deliberating when and how to curtail asset purchases. It did not actually start “tapering” until December 2013, and Treasury yields actually fell in 2014 from 3 percent at the start of the year to 2 percent by the end. The 2013 “Taper Tantrum” happened before anything actually “happened”. It’s fair to say it was a tantrum about Fed miscommunication rather than actual Fed policy.
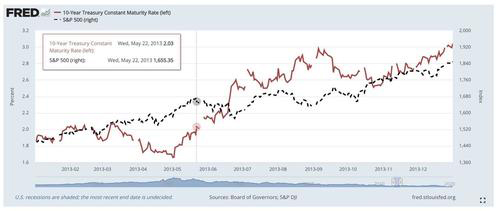
How it went: The chart below shows that 10-year Treasury yields (the solid red line, left axis) broke 2 percent the day Chair Bernanke uttered those words (highlighted by the info box) and essentially went directly to 3 percent by early September 2013. The S&P 500 (dotted black line, right axis), which had already rallied 16 pct YTD, stalled out from May 22nd all the way to October 8th (same price both days, 1655) before rallying another 12 percent into the end of the year. The maximum drawdown from “Taper Day” was 5 percent – the low you see in late June.
Takeaway: 2013’s capital markets “tantrum” was in Treasuries much more than US equities. The rapid rise in Treasury yields did throw a little cold water on stocks, yes. But let’s keep some perspective about that: 2013 as a whole was the best year for US stocks of the entire 21st century to date.
|
Send this article to a friend:
 |
 |
 |

![[Most Recent Quotes from www.kitco.com]](http://www.kitconet.com/images/live/s_gold.gif)
![[Most Recent USD from www.kitco.com]](http://www.weblinks247.com/indexes/idx24_usd_en_2.gif)
![[Most Recent Quotes from www.kitco.com]](http://www.kitconet.com/images/live/s_silv.gif)