It’s Getting Serious: Dollar’s Purchasing Power Plunges Most since 2007.
But it’s a Lot Worse than it Appears
Wolf Richter
 Fed officials, economists “surprised” by surge in CPI inflation, but we’ve seen it for months, including “scary-crazy” inflation in some corners. Fed officials, economists “surprised” by surge in CPI inflation, but we’ve seen it for months, including “scary-crazy” inflation in some corners.
The Consumer Price Index jumped 0.8% in April from March, after having jumped 0.6% in March from February – both the sharpest month-to-month jumps since 2009 – and after having jumped 0.4% in February, according to the Bureau of Labor Statistics today. For the three months combined, CPI has jumped by 1.7%, or by 7.0% “annualized.” So that’s what we’re looking at: 7% CPI inflation and accelerating.
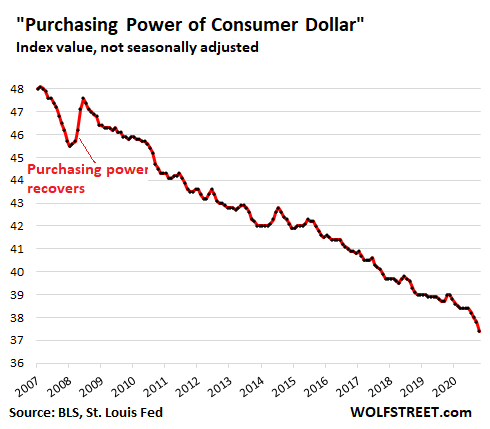
Consumer price inflation is the politically correct way of saying the consumer dollar – everything denominated in dollars for consumers, such as their labor – is losing purchasing power. And the purchasing power of the “consumer dollar” plunged by 1.1% in April from March, or 12% “annualized,” according to BLS data. From record low to record low. Over the past three months, the purchasing power of the consumer dollars has plunged by 2.1%, the biggest three-month drop since 2007. “Annualized,” over those three months, the purchasing power of the dollar dropped at an annual rate of 8.4%:
Folks in the business of dealing with inflation, such as economists and Fed officials, such as Fed Vice Chairman Richard Clarida, came out this morning in droves and said they were “surprised” by the red-hot CPI inflation.
There was nothing to be surprised about. We have been documenting red-hot inflation boiling beneath the surface for months, with “scary-crazy inflation” in used vehicles and in commodities, such as lumber, and surging factory input costs that are getting passed on because the entire inflation mindset has now changed.
The infamous Base Effect which I discussed over a month ago in preparation, and that now everyone is trotting out to explain away this red-hot inflation reading, was not at all responsible for the 7% annualized rate of CPI inflation over the past three months, or the 8.4% annualized drop of the purchasing power of the dollar. The Base Effect has nothing to do with it.
The Base Effect applies only to year-over-year comparisons. In April last year, CPI had dipped, and comparing today’s CPI index to that dip (the lower “base”) would include the Base Effect. On this year-over-year basis, CPI inflation rose 4.2%. But this has now become a useless number for two reasons: The sharply accelerating inflation in recent months, and the Base Effect that now mucks up the conversation.
That’s why I now use the past three months “annualized.” It gives the current pace of CPI inflation and bypasses the base effect.
But actual inflation is a lot worse
Two-thirds of the overall CPI is for services. They include many of the big things that are surging in prices, such as housing, healthcare, and insurance. Housing costs – rent and homeownership costs combined – weigh one-third of overall CPI. Housing inflation is the biggest category in CPI.
The rent component of CPI, called “rent of primary residence” (=7.8% of total CPI) ticked up only 0.2% in April from March, and has been ticking up at the same rate all year, for an annualized rate of 2.4%.
The homeownership component, called “Owners’ equivalent rent of residences” (=24.0% of overall CPI), also ticked up only 0.2%, for an annualized rate of 2.4%. But this is based on surveys of homeowners’ estimates of how much their home might rent for. It is essentially a measure of rent, as seen by the homeowner.
But the Case-Shiller Home Price Index, which is based on the sales-pairs method, comparing how the price changed over time for the same house, and is therefor a good measure of house price inflation, soared by 1.1% for the month, and 12% year-over year (purple line).
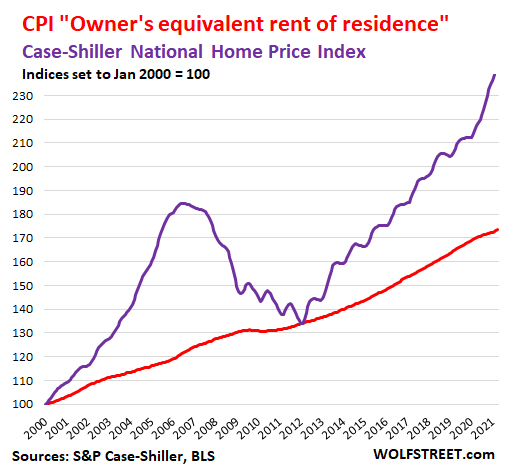
In other words, nearly a quarter of the CPI is based on this fabrication of “Owners’ equivalent rent of residences” that suggests 2.4% annual homeownership inflation, when in fact, it’s more like 12%.
CPI by major category
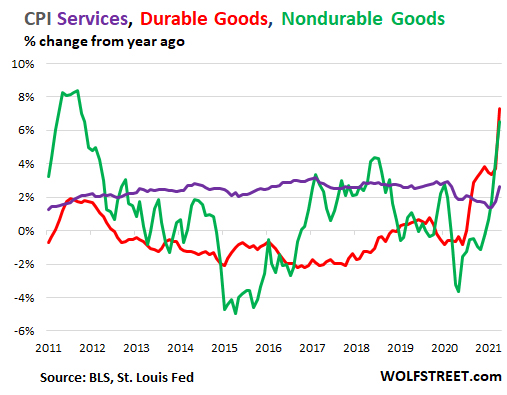
Services CPI. This fabrication of “Owners’ equivalent rent of residences” is also the reason why CPI for services is grossly understated. But still, the CPI for services (less energy services) jumped by 0.5% in April from March (=6% annualized), based on the increases in the other components (purple line in the chart below).
Durable Goods CPI. Prices of durable goods – cars, appliances, consumer electronics, etc. – spiked by 3.5% in April from March (=42% annualized… the “scary-crazy inflation I’ve been talking about). Compared to April last year, durable goods CPI is up 7.3% (red line)
Nondurable Goods CPI. This largely covers food and energy, including gasoline. It jumped 0.6% in April from March, or 7.5% “annualized.” Year-over-year, it was up 6.5% (green line);
But it’s still a lot worse: hedonic quality adjustments
These three major Consumer Price Indices – CPIs for services, durable goods, and nondurable goods – over the long-term show how much of a twisted political instrument CPI has become.
We already mentioned the economic freak show of the housing component in the services CPI.
For durable goods, there is another mechanism being applied that also makes sense on a conceptual basis: hedonic quality adjustments. But they too have been abused to force down the CPI, thereby turning the durable goods CPI into another economic freak show.
As goods, such as vehicles, are being designed with more features and improvements – such as the move over the decades from a three-speed automatic transmission to a 10-speed electronically controlled transmission – the price increases based on those “quality improvements” are removed from the CPI. The idea is that inflation measures price changes of the same item over time; and when the price change is based on improvements, it is not inflation because you’re getting more as you pay more.
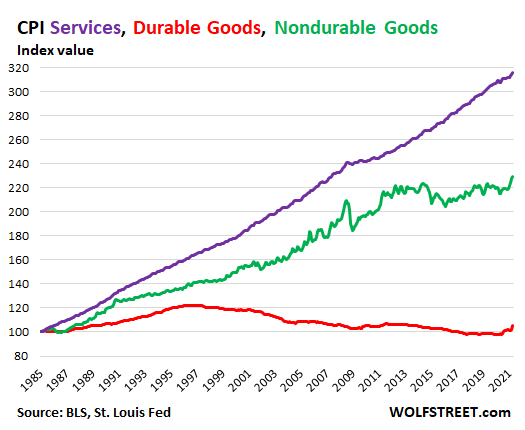
But in practice, these “hedonic quality adjustments” have been stretched to obviously ridiculous levels, as you can see in the chart below, where long-term inflation in durable goods (red line) was actually, you guessed it, negative, when in reality prices have skyrocketed.
The chart shows the three indices set at 100 for 1985 to show how they have diverged since then. That massive spike in durable goods in recent months barely registers in the long-term decline and will soon be whittled back down by hedonic quality adjustments, even if you have to pay 50% more for the product are few years from now:
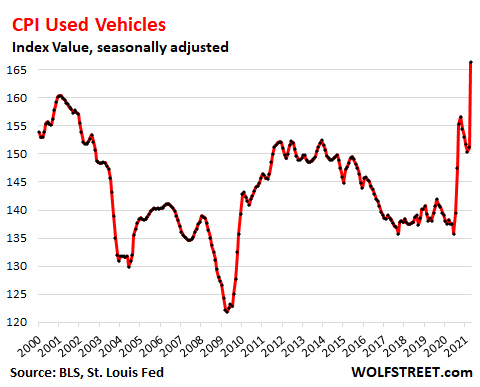
Used Vehicle prices blow out, despite hedonic quality adjustments. A big driver in the durable goods CPI spike was the CPI for used vehicles, which exploded by 10.4% in April from March, a scary-crazy increase that we have seen for months in used-vehicle wholesale prices, which have blown out.
This chart shows the CPI as an index, not year-over-year percent-change, and so the Base Effect does not apply. Hedonic quality adjustments are heavily applied to used vehicles, as you can see from the astonishing fact that the index in 2020 was below where it had been 20 years earlier, even though actual prices of used vehicles have soared over those 20 years. It took this massive spike in April to put the index above where it had been in the year 2000:
Enjoy reading WOLF STREET and want to support it? Using ad blockers – I totally get why – but want to support the site? You can donate. I appreciate it immensely. Click on the beer and iced-tea mug to find out how:

Would you like to be notified via email when WOLF STREET publishes a new article? Sign up here.
 Founder, Wolf Street Corp, publisher of WOLF STREET. Founder, Wolf Street Corp, publisher of WOLF STREET.
In his cynical, tongue-in-cheek manner, he muses on WOLF STREET about economic, business, and financial issues, Wall Street shenanigans, complex entanglements, and other things, debacles, and opportunities that catch his eye in the US, Europe, Japan, and occasionally China.
Wolf lives in San Francisco. He has over twenty years of C-level operations experience, including turnarounds and a VC-funded startup. He has a BA, MA, and MBA (UT at Austin).
In his prior life, he worked in Texas and Oklahoma, including a decade as General Manager and COO of a large Ford dealership and its subsidiaries. But one day, he quit and went to France for seven weeks to open himself up to new possibilities, which degenerated into a life-altering three-year journey across 100 countries on all continents, much of it overland, that almost swallowed him up.
wolfstreet.com
| 

![[Most Recent Quotes from www.kitco.com]](http://www.kitconet.com/images/live/s_gold.gif)
![[Most Recent USD from www.kitco.com]](http://www.weblinks247.com/indexes/idx24_usd_en_2.gif)
![[Most Recent Quotes from www.kitco.com]](http://www.kitconet.com/images/live/s_silv.gif)


