Send this article to a friend:
January
27
2024

|
Send this article to a friend: January |
|
Gold Forecast & U.S. Stocks Next 'Kill Zone'
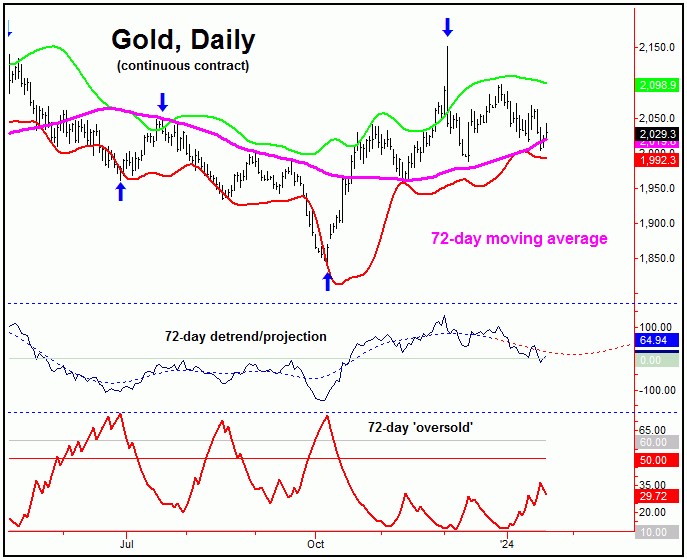
First, a look at the position of the Gold cycles. As per my last article from mid-December of last year, Gold was in a correction phase, one which was expected to last into early this year. This was due to the configuration of our 72-day time cycle, which is currently the most dominant cycle in the Gold market, and which is shown on the chart below:
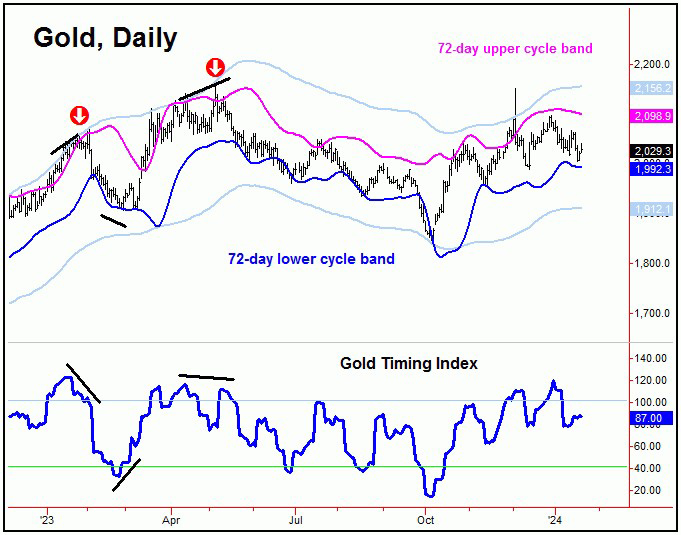
In terms of time, this 72-day wave was originally projected to bottom around this mid- January period, though the detrend that tracks this wave (which adjusts to the price action) suggests that it could push out a bit further. In terms of price, the best 'look' was for a drop back to the 72-day moving average for Gold - which has now been satisfied with the action into last week. Having said that, the lower 72-day cycle band will normally be hit as well, which has fallen just short - and with that the most recent bounce seems likely to fail. Gold Timing Index Our key indicator in analyzing the Gold market is called the 'Gold Timing Index', and which has been discussed in prior articles for Gold-Eagle. This indicator is a combined sentiment and momentum measure, and is shown on the chart below:
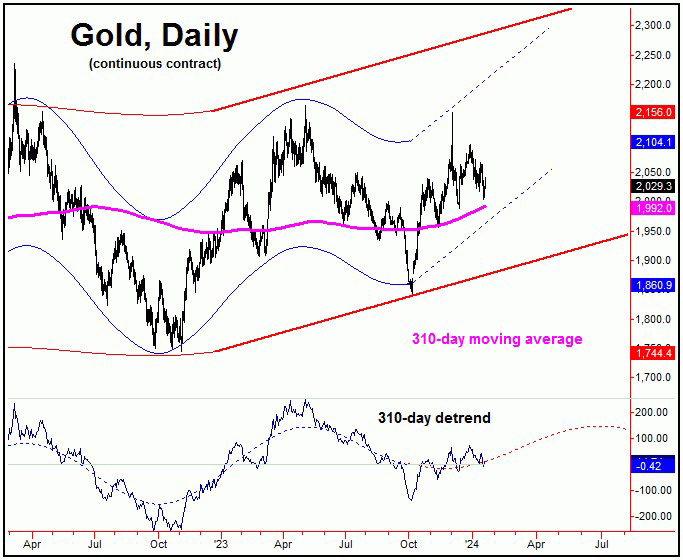
From my 12/17/23 article: "the 'trigger' for the next 72-day cycle bottom looks to be our Gold Timing Index. Price tends to form bottoms when our Gold Timing Index drops below the 40 level - as it did back in early-October. Right now, we are still in the middle-to-upper-end range with this particular indicator, which favors price to see additional correction in the coming weeks - following the completion of the recent short-term rally." As mentioned back in December, our Gold Timing Index was not in the range where we would expect to see a key low form, and with that the assumption was that lower lows would continue to materialize - which has obviously been seen with the action over the past month. Going further, we like to see our Gold Timing Index dropping to the 40 level or lower, which - with a current reading of 87 - is still a good distance away. Having said that, this can change quickly, with the most up-to-date chart/reading always posted in our thrice-weekly Gold Wave Trader market report. Gold's Mid-Term Picture In terms of patterns, the overall assumption is that the correction phase of our 72-day cycle will end up as a countertrend affair - due to the position of our larger 310-day wave, which is shown on the chart below:
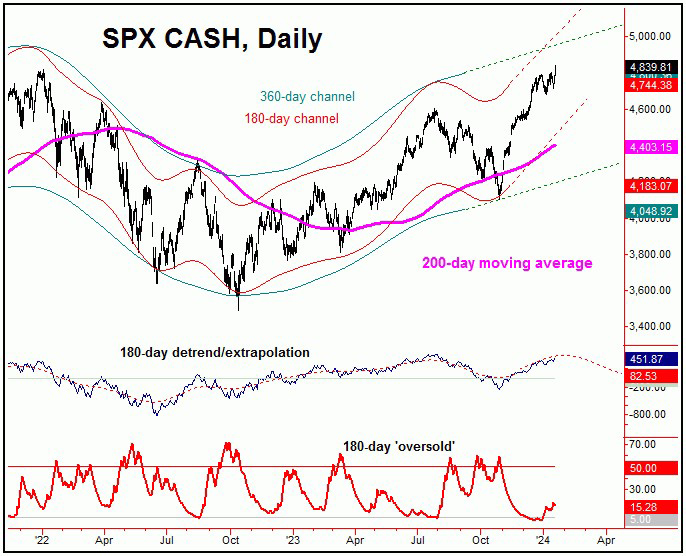
The above chart shows our 310-day wave in Gold, which is viewed as pointing higher into late-Spring or early-Summer of this year. With that, the favored path is for the current downward phase of the smaller 72-day wave to end up as countertrend, holding above the October, 2023 low - the last 72-day cycle trough. A countertrend correction with our smaller 72-day wave - if seen as expected - should set the stage for our next key bottom for Gold. Once this low is in place, the ideal path would look for a push back above the highs again on the next upward phase of this wave, with a 10-14% rally being the normal expectation. In terms of price, our upside 'reversal point' (the price which would confirm an upturn in our 72-day wave) is set at any push back above the 2099.80 figure (February, 2024 contract). However, this number is expected to drop sharply in the coming days, with the most current figure always posted in our Gold Wave Trader report. U.S. Stocks Vacuum Heads into Next 'Kill Zone' The last mid-term bottom in the SPX (i.e., S&P 500 Index) came from our 180-day time cycle, which troughed with the late-October tag of the 4103.78 SPX CASH figure - and with that was viewed as pointing higher into early this year. Shown below is that cycle:
From my 12/17/23 article: "we noted that a 17% rally was the normal expectation for the SPX, which was the average statistical rally for this wave - when coming off the pattern of a 'higher-low'. Going further with the above, this 17% rally was expected to come in a fairly short time window - thus creating a market 'vacuum', one which would sweep prices sharply higher into early 2024. This vacuum should take prices into our next 'kill zone' date, where the next mid-term top should eventually form for the U.S. stock market." As mentioned back in December (and in my daily/weekly Market Turns reports, back in early-November), a 17% rally was the normal expectation for the upward phase of our 180-day cycle, which targeted a test - or push above - the all-time high of 4818.62 on the SPX. With the action seen into late last week, this assumption has now been met. Having said the above, the markets can and often will go higher than statistical averages, and with that there is the potential for additional strength in the days/weeks ahead - before the next mid-term peak attempts to form in U.S. stocks. In our daily Market Turns report (https://cyclewave.homestead.com/) - which tracks the U.S. stock market - we have identified our next 'kill zone' date, which is the period where expect the next mid-term peak to form. Once this top is in place, the best decline of this year is expected to play out in the weeks to follow. For the bigger picture, however, the coming correction phase for U.S. stocks is expected to end up as a larger countertrend affair, holding well above the October, 2023 trough of 4103.78 SPX CASH. If correct, another larger-degree rally (20%+) would be expected to play out in the months to follow. Stay tuned. Jim Curry
In 1998 Jim put his cyclic methods to the test by entering the Etrade national options-trading competition, twice (his only two entries ever into the competition). In the first contest he finished in the top 10 out of over 150,000 entrants; in the second entry into the same contest, he just narrowly missed finishing in first place - over quadrupling a $100,000 account in the contest's short time span. What you are seeing when you view my market reports is a collection of over 30-years of experience in both numeric analysis and spectral methods - and in actually trading the methodology for myself and for the subscribers of my Gold Wave Trader (which covers Gold) and Market Turns (covering U.S. stocks) reports.
|
Send this article to a friend:
 |
 |
 |
 With the action seen over the past month, Gold has been locked inside an expected correction phase, with the U.S. stock market still inside a larger 'vacuum' period - one which will take us into the next 'kill zone' date for that market.