
Send this article to a friend:
January
18
2021

|
Send this article to a friend: January |
|
Gold Sheared, Silver Smeared
Silver was smeared this past week by -2.6% and is now -6.4% year-to-date. But relax: have a cracker 'n schmear, perhaps even a beer, and we'll try to relate to make it all clear. To be sure -- given all that we and you from here to Kalamazoo fundamentally understand about Gold -- its moving lower in the ongoing financial environment makes nary a wit of sense whatsoever. The market is never wrong by traders having put price where 'tis, irrespective of its going the wrong way. And given the fundamental precious-metals-positive state of essentially everything, 'tis diabolical that price descend. Indeed as Gold leapt out of the gate to commence the New Year by gaining +3.2% (and Silver +6.0%) within the first three trading days, it struck us that our call for a Gold high this year of 2401 may have been too conservative. And from the "Under-State and Over-Deliver Dept.", such 2401 forecast may still be too conservative even given the present pullback. Either way, Gold settled out the week yesterday (Friday) at 1828 ... which is but half the above Scoreboard's debasement valuation of 3644. Moreover, 'tis before President-to-be-Biden rolls out his nearly $2 trillion instant COVID/economic relief plan, which with Congress now all "blue" ought pass right through.
Of course 'tis, Squire, just as always is everything. (Pity the poor trader who thinks he has it all figured out before anyone else does: "Take a seat at the back of the bus, buddy..."). And again, please spare us the argument that bits**t is the modern alternative to Gold. Cryptocrap -- which within two trading days just fell -27% -- ain't fallin' into our lap. And again (again), the fundamental stance for Gold we continue to view as 100% positive given the ever-burgeoning levels of the 3Ds (Debasement, Debt, Derivatives), the declining Economic Barometer (as we'll below show), COVID clearly not contained (nor the effects of its vaccines preordained), and the endless spending of even more $trillions beyond the initial $2 trillion under Biden/Harris/Congressional reign! So: why has Gold been declining? Reprise: the technical stance for Gold may merely be viewed as price having leapt too far too fast, as least by its recent deviation above the 300-day moving average. To wit: since the start of the millennium we've had 5,043 trading days. Therein, Gold has settled more than 10% above its 300-day moving average a fair amount of the time: 1,697 days, to be precise (or one-third of days overall). That alone is a testament to the price of Gold rising over the long-term whilst all of the aforementioned fundamentals reduce the value of the faux doughDollar. In commencing 2021, so swift was Gold's up move that price found itself nearly 13% above its 300-day moving average. And from the year 2001-to-date, Gold's average price decline within three months upon a deviation of greater than 10% above that average is -6.2% (the standard deviation being 4.9%). So with Gold recently settling at 1954 (05 January), 'twas +12.6% above said average. A -6.2% decline from there puts price at 1833, (the recent low being 1817). 'Course, hardly have three months yet to ensue: thus let's further subtract the standard deviation which puts price down to 1739. On verra, but a positive Gold stance by the fundamentals belies such demise. Besides, as we saw a week ago, Gold's weekly parabolic trend has flipped from Short to Long, dubious as it appears on the following graphic of the price bars from one year ago-to-date. The wiggle room between the rightmost blue dot (1771) and present price (1828) is but 57 points, somewhat daunting as Gold's "expected weekly trading range" is now 72 points. Thus the new Long trend is within range of being Short-lived. And to quickly flip back to Short would leave any fundamentalist further flabbergasted. The point is: the Gold Bull ought not be put out of sorts should the lower 1700s be tested. Indeed, Gold appears to be structurally supported in the 1792-1673 range, but we don't honestly find any rationale for price to venture there.
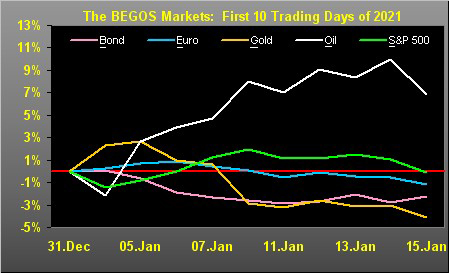
'Course, the Dollar has actually been getting a bit of a bid to start the year, which in turn is why the BEGOS Markets year-to-date ain't lookin' all that great, the sole exception being Oil which typically shall slide during a Dollar up-glide. (Speaking of Oil for those of you who follow the website's Market Rhythms page, the 12-hour MACD study looks to confirm a negative crossing in starting the new week). Otherwise, through these first 10 trading days of 2021, Gold as we below see is thus far the weakest of the five primary components which comprise BEGOS:
In trying to ferret it all out from the FinMedia, one may be better off with a shot of tequila. Try these "back-to-back" readings from the Dow Jones Newswires: "...the labor market is losing momentum amid rising coronavirus cases..." (followed by) "...This Could Be the Best Year on Record for Job Growth. Gains are expected to be driven by a re-emerging economy..." That must have come from their "Now and Then Dept." Or try this FinTimes and Reuters bit: "...JPMorgan, Citigroup and Wells Fargo cite increased certainty on vaccines and improving economic outlook..." (followed by) "...U.S. Labor Market Losing Speed as COVID-19 Spirals Out of Control..." And we know throughout history that such opposing opinions when elicited as policy result as follows:
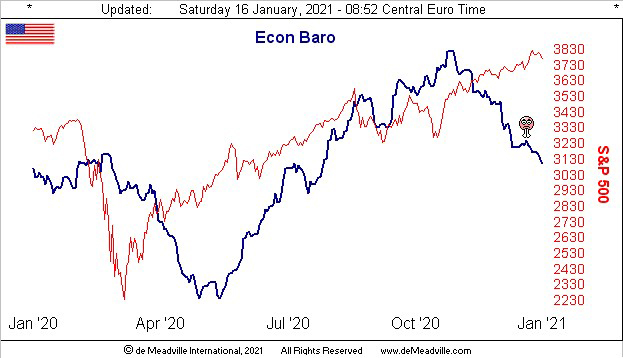
Fortunately to delineate truth vs. myth, respectively we've the Econ Baro (blue) vs. the S&P 500 (red) across the past 52 weeks:
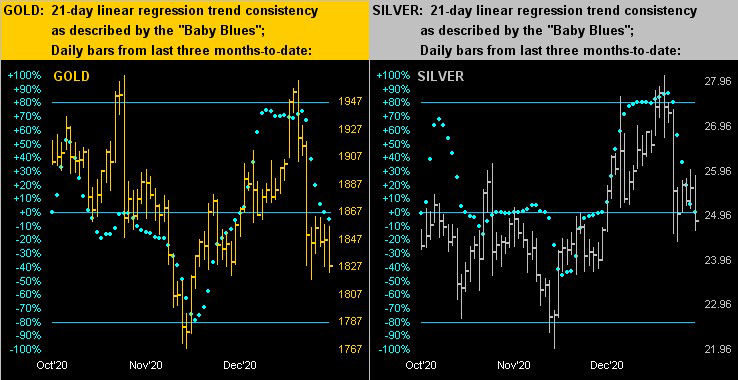
And it appears that the S&P finally is beginning to crack, the "live" price/earnings ratio being essentially a record -- indeed stratospheric -- 78.7x and our "textbook" technicals reaching "extremely overbought" this past Tuesday into Wednesday. 'Tis right in line as we've written of late that the S&P "is horribly due for a massive crash". Even a terrific Q4 Earnings Season would hardly right this ship: bottom lines ought need triple to-quadruple just to get the P/E in line with any acceptable historical norm. And hardly is the economy helping: beyond December's improvements in Industrial Production and Capacity Utilization, the month's Retail Sales actually shrank whilst Import and Export Prices rose. Can you say "stagflation"? As well, January's New York Empire State Index sported its weakest reading since July. Then we've Cleveland FedPrez "Jump Back" Loretta Mester pointing to the StateSide economy's needing strong 2021 government support, (and you know 'tis coming in $trillions: Got Gold?) Chiming in, too, is overall FedHead Jerome Powell stating the road to recovery for jobs is long with open-ended easy money to remain available. Again: Got Gold? Still, not everyone has got Gold (now that is to Under-State) nor are stocking up en masse as we turn to our two-panel graphic of Gold's daily bars from three months ago-to-date on the left and those for Silver on the right. Problematic for both markets is their respective sets of "Baby Blues" falling below the 0% axis, meaning that the 21-day linear regression trends have rotated from positive to negative: Sheared and smeared, indeed:
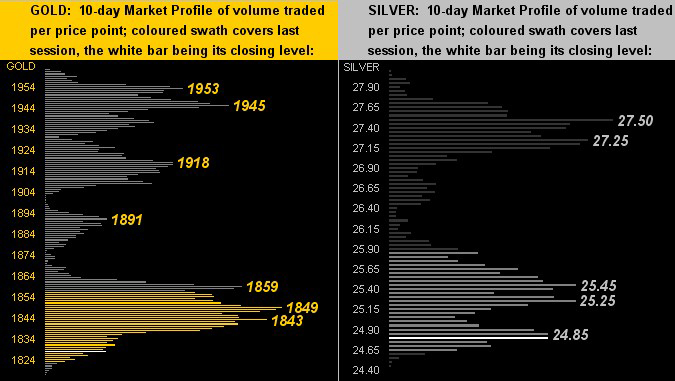
And as for the past fortnight -- which is year-to-date -- both precious metals obviously find themselves near the bottom of their respective 10-day Market Profiles:
We'll sum it up here with the stack:
Next week is lite for incoming economic data and brings joyous relief for the media in welcoming the 46th President of the United States via an Inauguration replete with virtual festivities. But 'tis said the 47th President in terms of time may not be far behind. So let the StateSide and geo-political schmear unfold whilst you fortify your financial well-being with Gold!
Mark Mead Baillie has had an extensive business career beginning in banking and financial services for two years with Banque Nationale de Paris to corporate research for three years at Barclays Bank and then for six years as an analyst and corporate lender with Société Générale.
|
Send this article to a friend:
 |
 |
 |
 Gold was sheared this past week by -1.2% and is now -3.9% year-to-date.
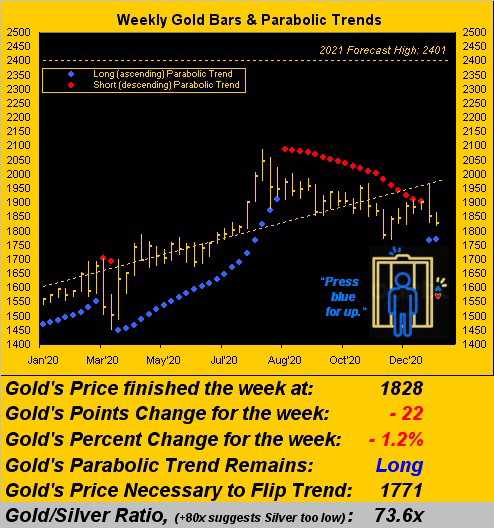


![[Most Recent Quotes from www.kitco.com]](http://www.kitconet.com/images/live/s_gold.gif)
![[Most Recent USD from www.kitco.com]](http://www.weblinks247.com/indexes/idx24_usd_en_2.gif)
![[Most Recent Quotes from www.kitco.com]](http://www.kitconet.com/images/live/s_silv.gif)