
Send this article to a friend:
December
18
2020

|
Send this article to a friend: December |
|
On a Bullish Track
After a strong 2019, the gold price took a hit in March 2020 as global liquidity evaporated and real interest rates spiked. However, the inevitable policy response of rate cuts, massive QE, and huge fiscal deficits quickly unwound that deflationary crunch and sent many risk assets soaring, and gold was well-positioned to ride that wave to new highs. Then, in August 2020, real Treasury rates began to rise, which led to a healthy correction in the gold price from near-term overbought conditions. Based on my core gold model, which compares the gold price to broad money supply per capita (normalized to 1973 and 1995 as my baselines), gold is approximately fairly-valued, with good long-term return potential in the years ahead. This following custom chart shows my model. The blue line is broad money supply per capita, and the red line is the gold price, and both of them are normalized to 100 in 1973. The thin green line, for additional context, is the real 10-year yield, which means the 10-year Treasury bond interest rate minus officially reported consumer price inflation:
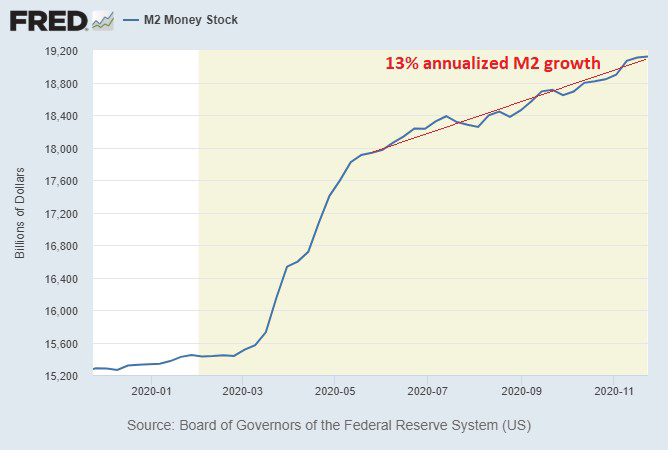
Chart Source: St. Louis Fed Over the long run, gold has a tendency to keep up with monetary inflation. Or, perhaps a more accurate way to put it, is that the dollar has a tendency to devalue against gold at roughly the rate that it is increased per capita, while gold holds its purchasing power. When the gold price gets way above the broad money supply line on the model, it means it’s historically overvalued by that metric. When it’s at, near, or below the money supply line, gold tends to be a safer long-term bet. However, gold is volatile, and can overshoot or undershoot that fundamental trend line. It usually overshoots that model when real rates go sharply negative, meaning moments in time where inflation is higher than Treasury bond yields by 100 basis points or more. These gold price spikes happened in 1974, 1980, and 2011, and when they ended, gold went back into a multi-year bear market. The difference between now and 2011, is that gold didn’t get very far above this model here in 2020, while in 2011 it did. Broad money grew a lot more quickly in 2020 than any other year since the 1940s, so gold’s price rise was justified, and only overshot mildly. The correction since August has already put it back within the realm of fair value. Meanwhile, after the one-time massive increase in broad money supply that occurred in the spring of this year due to the CARES Act, the broad money supply is still growing at a 13% annualized rate, which is rather structural at this point, even without specific stimulus:
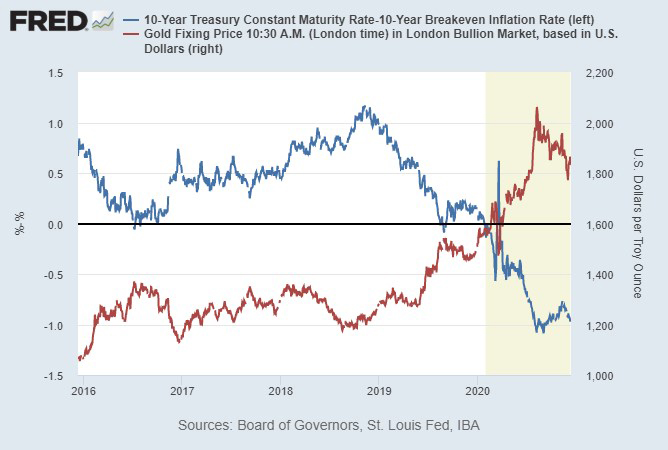
Chart Source: St. Louis Fed This above-average rate of money supply creation is occurring mainly due to large fiscal deficits that are being monetized by the Federal Reserve. Gold should, in the fullness of time, continue to roughly keep up with that pace. At this stage in the long-term debt cycle, money is being created faster than GDP growth. The biggest risk for gold in the year ahead is rising nominal Treasury yields. Gold’s local peak in August corresponded with the low in real yields, at -1.08%. Since then, as nominal yields rose faster than inflation expectations, the real rate rose slightly. It’s still negative, but it’s not as negative as it was in August. This chart shows the price in gold in red, and real 10-year Treasury rates in blue, over the past five years:
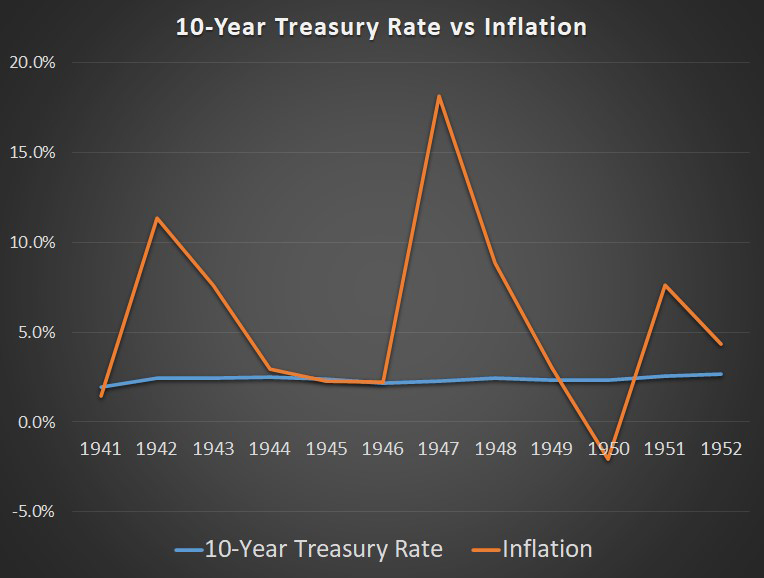
Chart Source: St. Louis Fed The next 3-6 months have plenty of uncertainty. Renewed shutdowns in Europe, Asia, and the United States can result in another period of disinflation. As we go deeper into 2021 and 2022, however, I think inflation can easily start to heat up, as economies re-open, commodity demand heats up, and money velocity starts flowing. If Treasury bonds keep pace with inflation, it can keep gold from overheating too much, but gold should, over a 3-5 year period, do rather well regardless. The Endgame Gold Spike There is an endgame scenario that can shoot gold way past my model to the upside, and it remains my long-term base case, although I don’t strongly plan my gold target around it in any given year, since its timing is hard to predict. It could happen in late 2021, or it could happen deeper into the 2020’s decade, but I expect it to occur at some point and am watching for signs of it building. This endgame scenario that I’m describing would be a sharp rise in broad consumer price inflation, combined with formal yield curve control by the Federal Reserve. Formal yield curve control happens when a central bank declares that it will peg the sovereign bond market to certain yield, including long-duration bonds. The mechanism is that the central bank prints money and buys as many bonds as needed to enforce that peg. The reason to do so is to prevent federal interest expense from getting too high. And the cost to do so is a sharp currency devaluation. This scenario last occurred in the 1940s, which was the only other time in US history that federal debt as a percentage of GDP reached as high as it is now, and with deficits that were as big as they are now. Here’s a chart of official CPI and 10-year Treasury yields in the 1940’s decade, showing that no matter how high CPI spiked, the Fed held yields at 2.5% like clockwork, which meant that folks holding cash and Treasury bonds lost purchasing power over the decade:
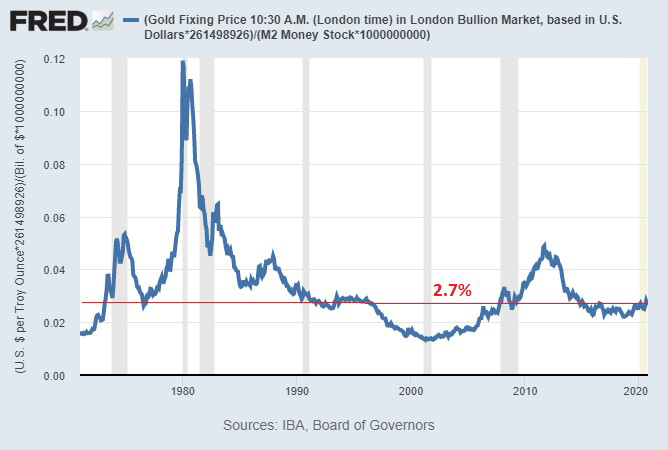
Chart Source: Lyn Alden, Data Source: US Federal Reserve Fed officials first began discussing yield curve control again in 2019, brought it up during meetings in early 2020, and by mid-2020 decided that they don’t need it yet. However, investors should keep it on their radar. If policymakers succeed in generating 3% inflation or higher at some point in this cycle, but don’t want Treasury yields to go much above, say, 2%, then yield curve control becomes quite probable in my view. At that point where formal yield curve control is used, the bid for gold and other hard assets from portions of the cash market and bond market could become quite intense to defend against debasement, resulting in a 1970s-style gold price spike. Gold, silver, Bitcoin, and industrial commodities could all benefit. With sharp enough demand, it could potentially blow up the futures market’s ability to physically deliver gold, which could further elevate the price of any “real” gold that is physical or fully-allocated, compared to some of the paper market. So, for that potential scenario, I keep another chart on hand. It’s the percentage of broad money supply theoretically backed by US Treasury official gold holdings, at current prices. Unlike my core model described earlier, this one is not adjusted per-capita. Right now, the US Treasury has an amount of gold that could theoretically back only 2.7% of its broad money supply (M2), which is well below the historical average:
Chart Source: St. Louis Fed I continue to emphasize diversification, with a healthy allocation to top-quality stocks, as well as a variety of natural resources or scarce assets including gold, silver, industrial metals, strong energy producers, and select digital assets such as Bitcoin. Although the broader market is starting to wake up to a reflation narrative and the potential for commodity outperformance, big index money is still heavily in the S&P 500 and bond market, rather than in these more contrarian areas. There is plenty of runway in the years ahead for commodity and hard asset sectors to do well vs the broader indices, as oceans of money allocate even a small bit towards these assets that are mere ponds in comparison. Read more perspectives from Lyn at Lyn Alden Investment Strategy.
I provide tens of thousands of investors per month with research, information, and tools to help them build wealth and reach financial freedom. Some of my content is aimed at new investors, while the most of my topical articles are aimed at more experienced investors. This site provides equity research and investment strategies to give you the insight and data you need for managing your money through all market conditions.
|
Send this article to a friend:
 |
 |
 |
 The full-year 2020 was a wild year for gold.
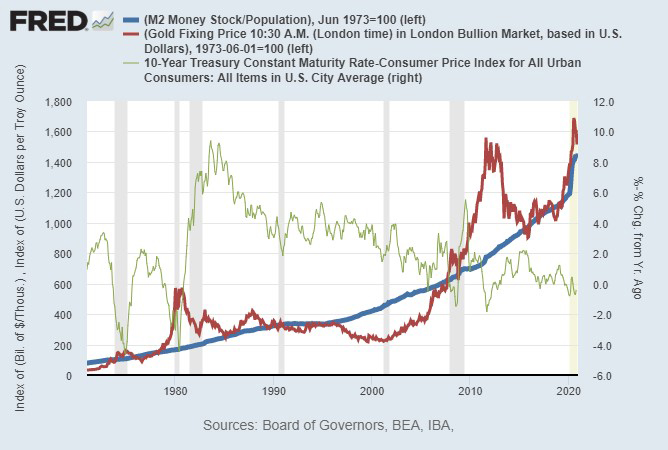

![[Most Recent Quotes from www.kitco.com]](http://www.kitconet.com/images/live/s_gold.gif)
![[Most Recent USD from www.kitco.com]](http://www.weblinks247.com/indexes/idx24_usd_en_2.gif)
![[Most Recent Quotes from www.kitco.com]](http://www.kitconet.com/images/live/s_silv.gif)