
Send this article to a friend:
December
14
2018

|
Send this article to a friend: December |
|
A Very Rare Setup: Who Will Win The Tug Of War In The Oil Market?
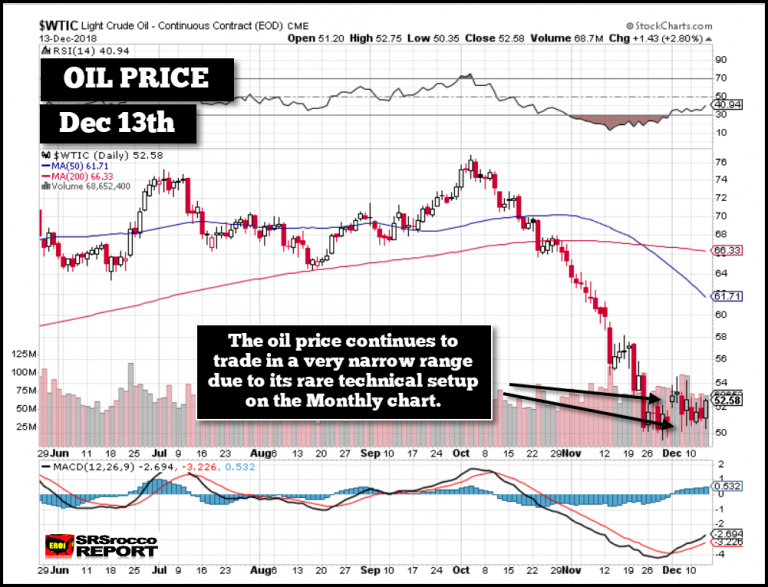
Ever since the oil price peaked at $77 at the beginning of October, it has fallen $25 and is now trading in a tight volatile range between $50-$53. As we can see in the chart below, the oil price dropped to $50 at the end of November and now has been trading up and down with no clear direction: Oil Price Daily Chart (Each candlestick = 1 day of trading)
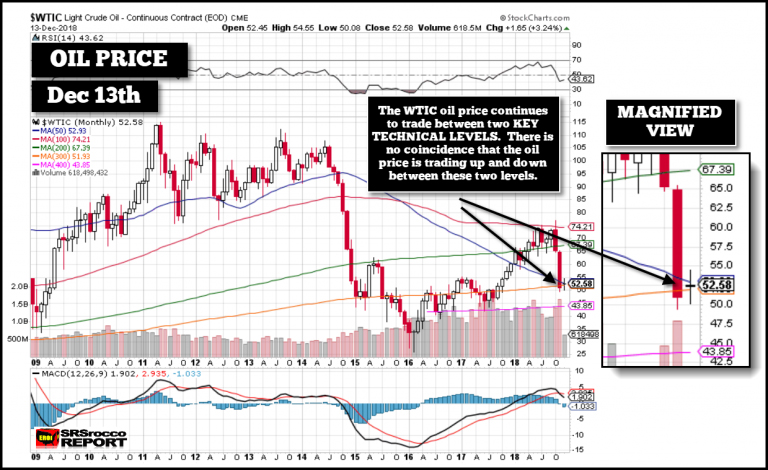
Even though the oil price touched $54 for a few days, it has mostly been trading in a tight $3 range. In looking at this daily chart, we have no idea why the oil price is behaving in such a way. However, if we look at the longer-term monthly chart, we can see the apparent reason why. The oil price has been pushed between the 50 Month Moving Average (BLUE) and the 300 Month Moving Average (ORANGE): Oil Price Monthly Chart (Each candlestick = 1 month of trading)
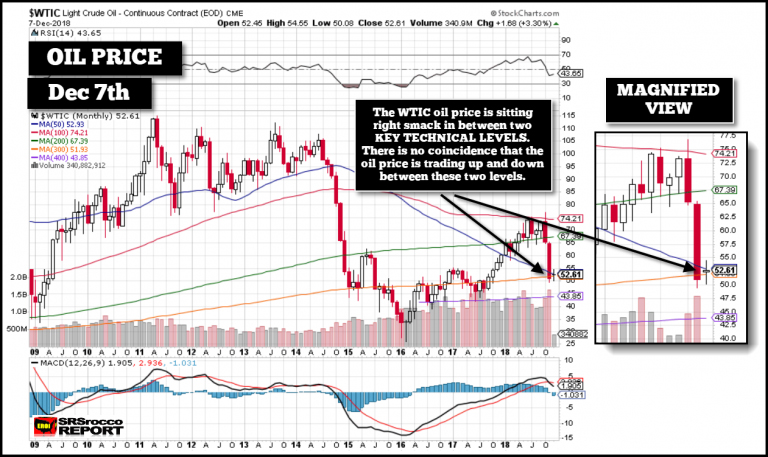
If you look at the magnified view, you will see that the oil price that closed today at $52.58 remains between these two moving averages. The large red candlestick shows the decline in the oil price in November as each candlestick represents one month of trading. So, the current candlestick that looks like a Cross (called dogi) is for the first two weeks of trading in December. Thus, the reason the oil price in the first daily chart above hasn’t moved from the narrow range can be found by looking at the monthly chart. It is a rare occurrence for two monthly moving averages to meet together and even more extraordinary when the oil price is trading between them. Now, if we look at the oil chart a week ago (Dec 7th), it looks almost the same: Oil Price Monthly Chart
This monthly chart of oil was taken on Dec 7th, and that day the price closed at $52.61, just 7 cents less than the end of day price today. With the oil price stuck between these two technical levels, traders are fighting it out to see who wins. However, I believe the bears will eventually win by pulling the price lower. This next chart shows how the technical levels also guide the oil price in the WEEKLY chart: Oil Price Weekly Chart (Each candlestick = 1 week of trading)
You will notice that the oil price topped at the 400 Week Moving Average (PINK) and is now trading around the 200 Week Moving Average (GREEN). In looking at this oil price weekly chart and the RSI indicator on the top, it seems oversold. Which means the oil price may move higher first before continuing to head lower. But, if we look at a more extended 5-year weekly chart, the oil price can sell-off a GREAT DEAL MORE: Oil Price Weekly Chart (5-years)
When the oil price was trending lower in 2015 and 2016, it continued to sell off in December during both years (TWO BLACK ARROWS). As the U.S. economy continues to roll over along with a weak oil price and falling demand in the winter, I believe the oil price will likely fall towards the $40 level. If the oil price continues to fall to $40 and possibly $30, it will destroy the already weak U.S. shale oil industry. To make matters even worse, the companies producing shale in the North Dakota Bakken are receiving a whopping $25.75 a barrel. According to the extensive list of global oil spot prices (100+) published on OilPrice.com, the North Dakota Williston Sweet crude price plunged nearly $4o from its high in October when it was trading at $64. So, if you are an investor in one of the shale companies in the Bakken, like Continental Resources, you have my sympathy.
|
Send this article to a friend:
 |
 |
 |


![[Most Recent Quotes from www.kitco.com]](http://www.kitconet.com/charts/metals/gold/t24_au_en_usoz_2.gif)
![[Most Recent USD from www.kitco.com]](http://www.weblinks247.com/indexes/idx24_usd_en_2.gif)
![[Most Recent Quotes from www.kitco.com]](http://www.kitconet.com/charts/metals/silver/t24_ag_en_usoz_2.gif)