
Send this article to a friend:
December
20
2018

|
Send this article to a friend: December |
|
The U.S. Shale Oil Industry Bloodbath Spreads As Oil Price Meltdown Continues
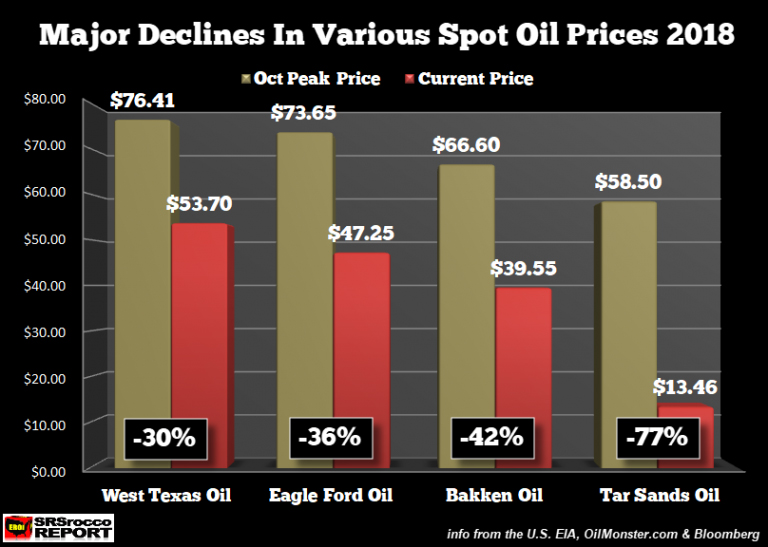
The major problem with the U.S. shale oil industry from the get-go was that the huge decline rates, indicative of horizontal fracking, devour a massive amount of capital. Furthermore, capital expenditures that are used to frack a shale well is a much different animal than building a gold mine. Because shale oil wells experience a 75-80% decline rate in the first few years, the industry must continue to spend even more capital to offset oil production losses. However, capital spent on a gold mine will last for 15-20+ years before the deposit is depleted. So, capital spent in the U.S. shale oil industry is not really a long-term investment as would be a gold mine. Thus, the capital expenditures in the shale oil industry behave more like “COSTS” than “INVESTMENTS.” The Oil Price Meltdown Continues If energy analysts thought oil prices were getting a bit oversold last week, this week the market has now entered into a “Meltdown phase.” A few weeks ago, I published this chart showing the change in various oil spot prices since the peak in early October:
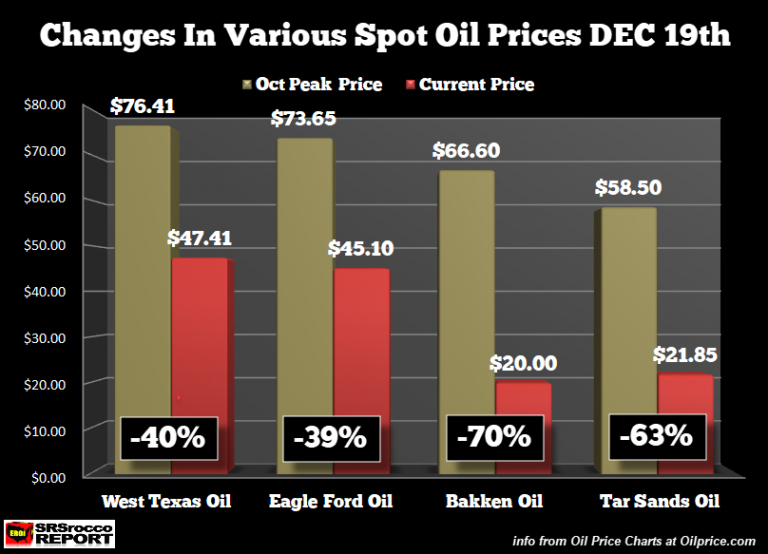
All across the board, oil prices fell considerably. The worst performer in the group was Tar Sands Oil (Western Canadian Select) when bottlenecks of too much oil in Alberta with no place to go pushed prices down to the low “teens.” However, the Alberta government finally stepped in and announced a mandatory cut in production (insisted by the tar sands industry) which had a dramatic impact on the Western Canadian Select spot price. The very next day, the price more than doubled. I believe the Western Canadian Select oil price reached $28 before correcting lower to $21 with the downward pressure in the overall market. Here is a new update of the chart above. As you can see, the BIG LOSER now is in the Bakken.
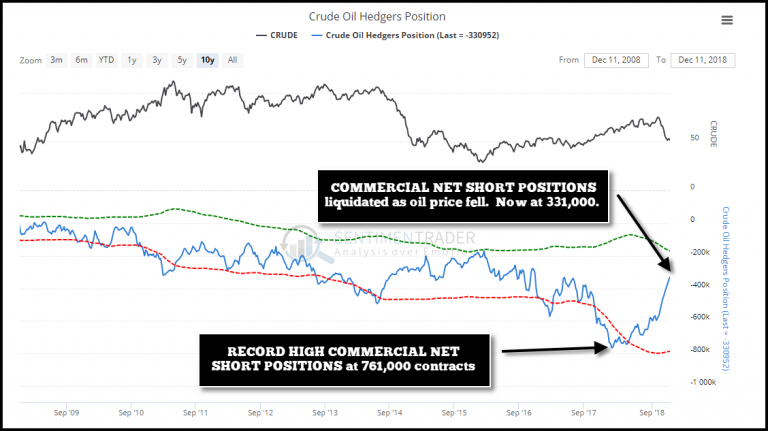
According to the oil price quotes from The OilPrice.com site, the Williston Sweet crude fell to a gut-wrenching low of $20 from $39.55 back on Dec 1st. I encourage my readers to check out the OilPrice.com site for their excellent articles and the over 100+ spot prices. You can look at all the various spot prices here: OilPrice.com Oil Price Charts. So, the irony of the figures in the chart above is that the higher-cost unconventional oil supplies out of the Bakken and Alberta tar sands are receiving the lowest price. This is like buying a Mercedes but trying to pay for it with a salary as a Fry Chef at McFats Burgers-R-Us. At some point, the lousy economics will finally catch up. The Oil Price Meltdown = Shale Oil Industry Bloodbath As the oil prices continue to fall, the bloodbath spreads to more of the shale industry. I will explain why in a minute, but let’s look at some of the details behind oil meltdown. The falling oil price wasn’t a surprise to me. However, it took a bit longer to occur. I started writing about the coming oil price crash in the early part of 2018 when the stock market was at its all-time highs. In early 2018, the Commercial net short position in oil was a record 761,000 contracts. However, as the oil price finally declined, the Commercials liquidated their short positions and now only hold 331,000. But, when the oil price reached a low of $28 in January 2016, the Commercial net short position fell to 169,000 contracts. So, we can see that there is still plenty of room for the oil price to drop as Commercials still hold 162,000 more net short contracts then they did in January 2016:
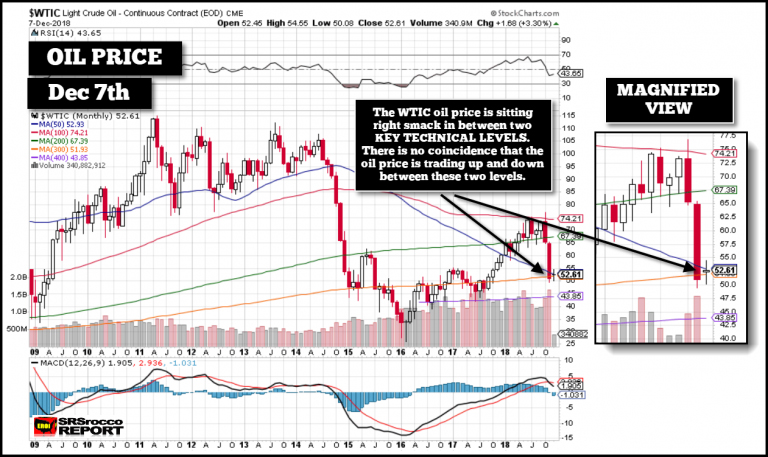
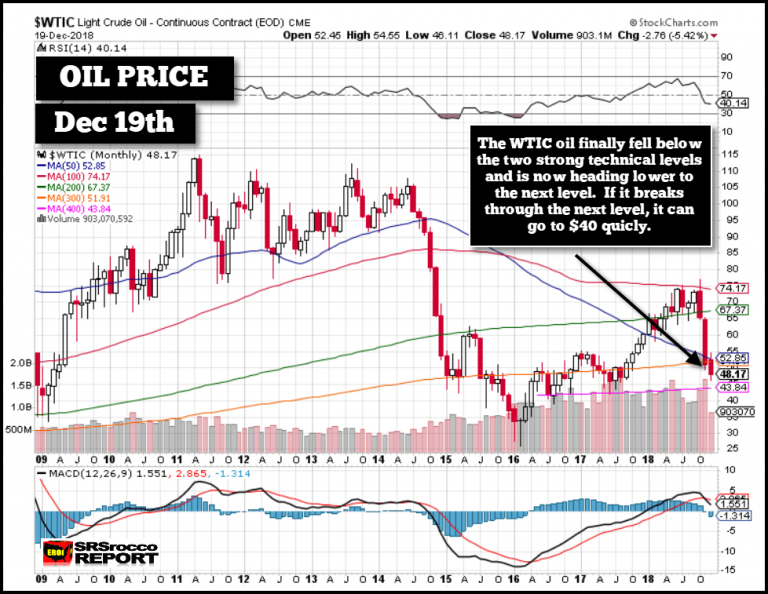
For those new to understanding the commercial net short position, the higher the number of contracts the higher the oil price goes. When the oil price starts to decline, the Commercials cover or liquidate their short positions. So, the graph of the oil price (BLACK LINE) and the Commercial net short position (BLUE LINE) are inverted; they run opposite to each other. Okay, let’s take a look at the next two monthly oil price charts. I posted the first chart on December 7th showing how the oil price was stuck between two critical technical levels:
I stated that there was a “Tug of war” between the traders, but in the end, the bears would likely win as the conditions in the oil market would continue to weaken in the winter months. Here is an update of the chart:
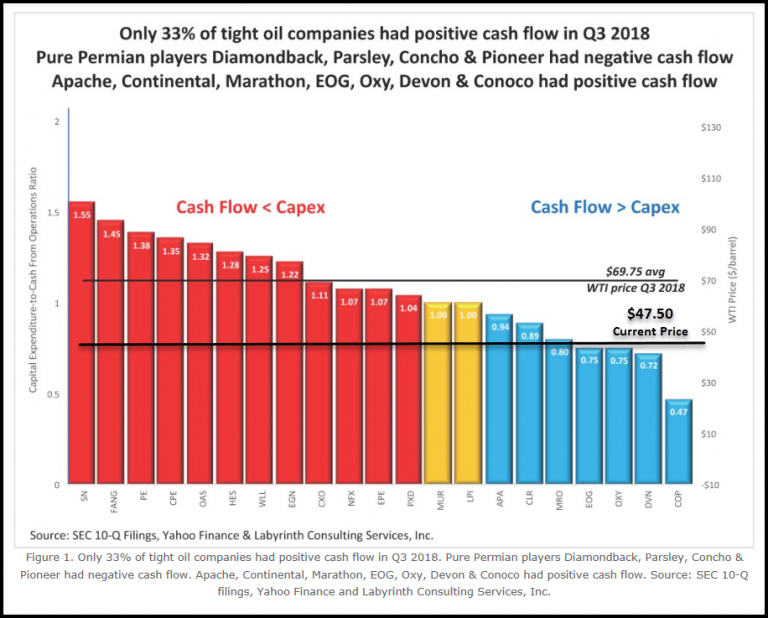
With the oil price now firmly below both of those technical levels (50 MA – BLUE & 300 MA – ORANGE), it seems that it will move toward the next level (400 MA – PINK), to the lower $40’s. If the oil price falls below that level, it can quickly drop to $40 or lower. However, nothing goes down in a straight line, and we could see higher oil prices first. But, if the oil price does fall to $40, make sure you send some Holiday Care Packages to the shale oil companies… they’ll need it. Now, It doesn’t take a rocket scientist to figure out that investors in the Shale Industry must be dumb as a box of rocks. Please understand, I don’t mean to be disrespectful, but enough is enough. According to my analysis, the majority of the shale oil industry continues to spend more money than they make. So, why would anyone invest in a company that continues to lose money? I gather if rocks could talk, they would probably be offended that I compared them with shale energy investors. Regardless, energy analyst Art Berman also puts the shale oil industry into proper perspective. In one of his recent charts, he showed how only 33% of the companies producing shale oil made positive free cash flow. The data in this chart was based on the average oil price of $67.95 in the third quarter of 2018:
Chart by Art Berman with my current oil price line annotation I added my own line with the new current $47.50 oil price. Any company above that line is now losing money. Which means the 33% of companies making money are now more like 15% or 3-4 companies at the most. Or, it could be even worse than that. So, I imagine Mr. Berman will probably update that chart showing a lot more RED BARS. Furthermore, the situation for the companies in the Bakken will be hit much harder due to the huge reduction of the Williston Sweet oil price versus the West Texas Oil price. And while fourth-quarter results in the shale patch will be impacted negatively due to lower oil prices, I believe the financials will be even worse in the first two-quarters of 2019. We must remember, oil prices were still quite high in October, so the average price for Q4 won’t be that low. However, next year, the average oil price could be in the low $40’s. Well, it looks like Santa Claus won’t be bringing any gifts or good cheer for the U.S. Shale Industry this year. IMPORTANT NOTE: If you are new to the SRSrocco Report, please consider subscribing to my: SRSrocco Report Youtube Channel. HOW TO SUPPORT THE SRSROCCO REPORT SITE: My goal is to reach 500 PATRON SUPPORTERS. Currently, the SRSrocco Report has 155 Patrons now! Thank you very much for those who became new members and new Patrons of the SRSrocco Report site. So please consider supporting my work on Patron by clicking the image below:
Or you can go to my new Membership page by clicking the image below:
Check back for new articles and updates at the SRSrocco Report. You can also follow us on Twitter, Facebook, and Youtube below:
|
Send this article to a friend:
 |
 |
 |


![[Most Recent Quotes from www.kitco.com]](http://www.kitconet.com/charts/metals/gold/t24_au_en_usoz_2.gif)
![[Most Recent USD from www.kitco.com]](http://www.weblinks247.com/indexes/idx24_usd_en_2.gif)
![[Most Recent Quotes from www.kitco.com]](http://www.kitconet.com/charts/metals/silver/t24_ag_en_usoz_2.gif)